The technical lineage viewer shows the technical lineage and allows you to edit the view. You can access the technical lineage viewer via the Technical lineage tab on Column and Table asset pages and BI assets of the same level.
The technical lineage viewer shows the technical lineage and allows you to edit the view. You can access the technical lineage viewer by clicking Technical Lineage in the tab bar on Column and Table asset pages and BI assets of the same level.
Technical lineage tab
You can see the Technical Lineage tab on a Column or Table asset page only when you have the following prerequisites:
- You have Collibra Platform 2025.11 or newer.
- You have a global role with the Catalog global permission, for example, Catalog Author.
- You have a global role with the Technical lineage global permission.
- To use the latest technical lineage viewer UI, turn on the Latest technical lineage viewer toggle on the Technical lineage settings page. Important
- If you have not run a synchronization since August 11, 2025, you must re-run it before enabling this setting to create the new technical lineage graph for use in the latest technical lineage viewer UI.
- You can disable the setting at any time to switch back to the classic technical lineage viewer UI.
View permissions are not enforced in Collibra Data Lineage. This means that anyone with the Technical Lineage global permission can see all of the assets in a technical lineage graph, regardless of their view permissions as determined at the community or domain level.

|
No |
Name | Description |
|---|---|---|

|
Toolbar |
The toolbar to work with technical lineage. The toolbar helps you to edit basic settings that apply to the entire lineage. |
|
|
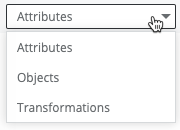
The drop-down list to determine which details you want to show in the technical lineage graph. The drop-down list includes the following options:
|
|

|
|
The button to zoom in on the technical lineage. |

|
|
The button to zoom out on the technical lineage. |

|
|
The button to refresh the technical lineage. This discards all the changes that you made to the technical lineage and restores it to the initial state. |

|
|
The button to reposition the technical lineage to the starting position. |

|
|
The button to show or hide the legend panel. |

|
|
The button to show or hide the source code pane. |

|
|
The button to show or hide the Browse and Settings tab panes. |
|
|
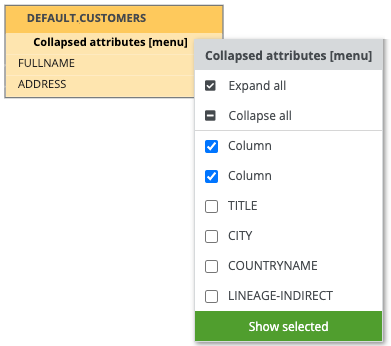
The actual visualization of the traceability of the current data object, according to your selection in the Browse tab pane. If you select a specific column in a table with multiple columns, you can right-click the column and hover over Collapsed attributes to show all other columns or only the selected columns in the same table.
Tip Data objects that are stitched to assets in Data Catalog have a yellow background. Other data objects that CollibraData Lineage collected from your data source, but are not stitched and therefore are not assets in Data Catalog, have a gray background. |
|
|
|
Tab panes |
Tab panes that contain useful tools to browse through your technical lineage or determine which content is visualized in the technical lineage. |
|
Browse tab pane
|
This pane can be used to search for specific data objects or show statistics on the amount of tables and views in use. More information. |
|
|
Settings tab pane
|
This pane can be used to search for transformation code, edit the visualization of the technical lineage, see the status of the source code, check the stitching results or export your technical lineage to PDF, PNG or CSV. More information. |
|
|
|
The source code pane shows the source code of specific data objects. It can be used to easily find issues in the data flow. The source code pane is shown when you click
For Collibra Data Lineage to correctly highlight the transformation logic, as indicated by the blue highlighting in the previous image, we strongly recommend that your SQL files have Unix line endings. Non-Unix line endings, for example Carriage Return (CR) and Line Feed (LF) line breaks, do not influence the extracted lineage and can result in incorrect highlighting. |

|
No |
Name | Description |
|---|---|---|
|
|
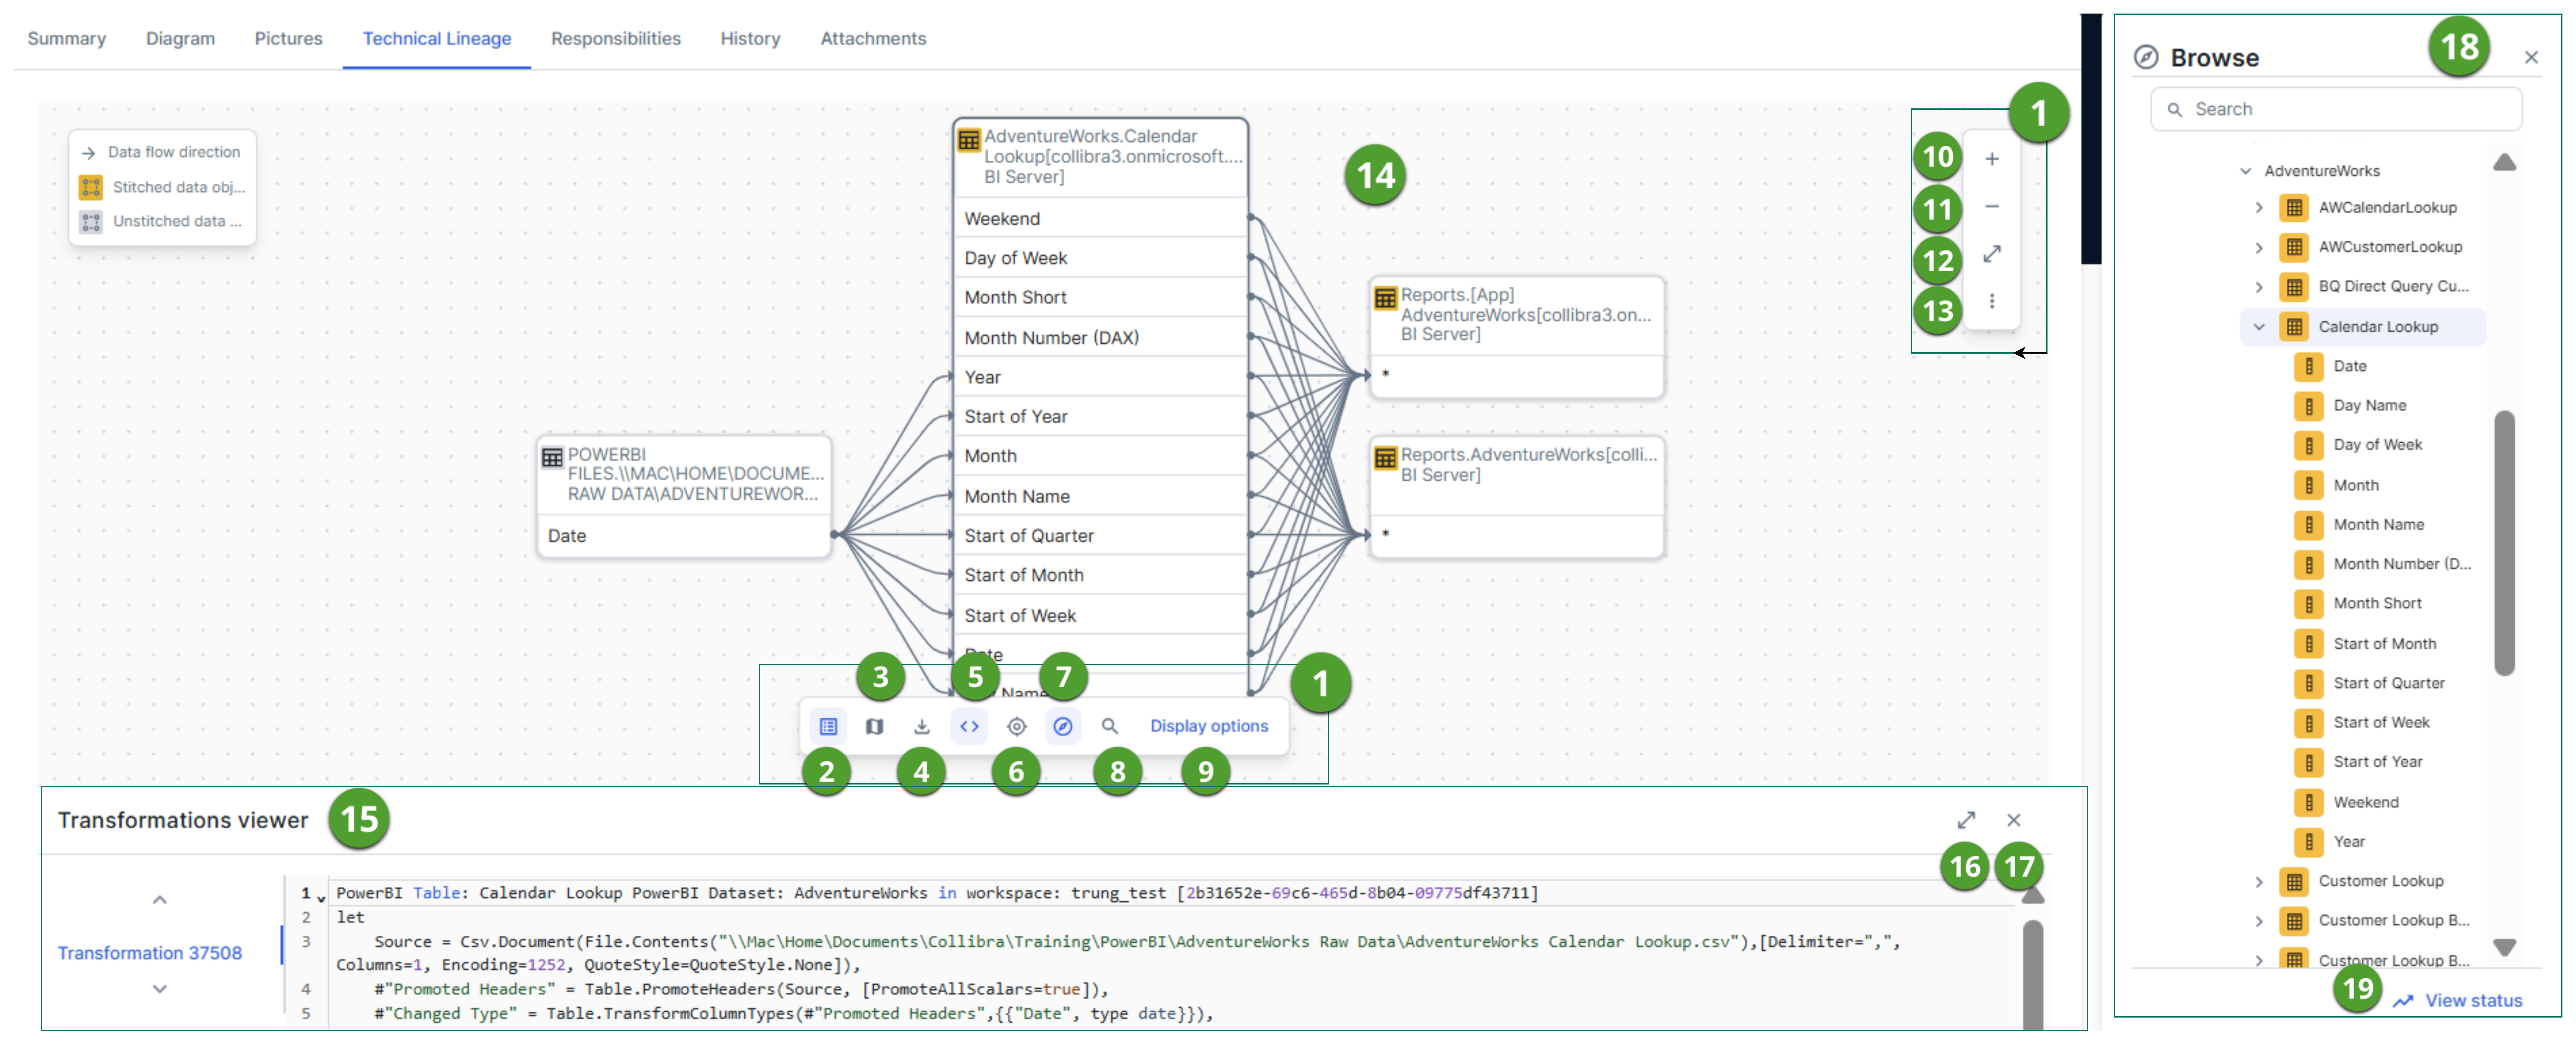
Toolbar |
The toolbar to work with technical lineage. The toolbar helps you to edit basic settings that apply to the entire lineage. |
|
|
The button to show or hide the legend of the technical lineage graph.
|
|
|
|
|
The button to show or hide the minimap, which shows the zoomed-out view of the technical lineage graph. You can quickly understand the structure and navigate to different sections by dragging or clicking within it. Note Performance of the minimap for large technical lineage graphs will be optimized in a future release.
|
|
|
|
The button to export the technical lineage graph in the following format:
Note The latest technical lineage viewer does not support the Full Batch CSV or JSON Lineage export formats. To export full-batch lineage, use the
Export lineage option in the Technical Lineage Admin capability. |
|
|
|
The button to show or hide the transformations viewer. |
|
|
|
The button to reposition the technical lineage to the starting position. |
|
|
|
The button to show or hide the Browse pane. |
|
|
|
A search field that you can use to find a specific data object in the technical lineage graph. Enter the name of a database, schema, table, or column. |
|
|
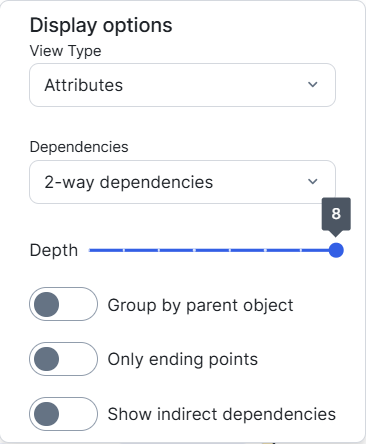
Display options |
The button to open display options. Use the Display options pane to edit the visualization of the technical lineage,
|

|
|
The button to zoom in the technical lineage graph. |

|
|
The button to zoom out the technical lineage graph. |

|
|
The button to expand the canvas. |

|
|
The button to show the following options:
|
|
|
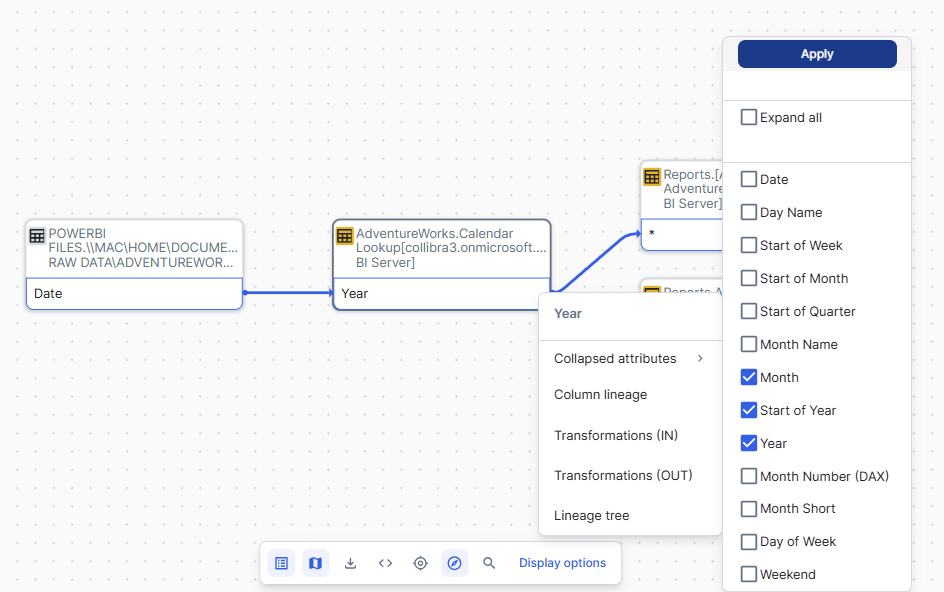
The actual visualization of the traceability of the current data object, according to your selection in the Browse pane. If you select a specific column in a table that contains multiple columns, you can choose to display all other columns or only the selected columns in the same table:
Tip Data objects that are stitched to assets in Data Catalog have yellow icons. Other data objects that Collibra Data Lineage collected from your data source, but are not stitched and therefore are not assets in Data Catalog, have gray icons. |
|
|
|
The Transformations viewer pane shows the source code of specific data objects. It can be used to easily find issues in the data flow. The Transformations viewer pane is shown when you click
For Collibra Data Lineage to correctly highlight the transformation logic, as indicated by the blue highlighting in the previous image, we strongly recommend that your SQL files have Unix line endings. Non-Unix line endings, for example Carriage Return (CR) and Line Feed (LF) line breaks, do not influence the extracted lineage and can result in incorrect highlighting. |
|

|
|
The button to expand the Transformations viewer pane . |

|
|
The button to close the Transformations viewer pane. |
|
|
Use this pane to browse through your technical lineage and search for specific data objects in this pane. |
|

|
|
The button to show the Status pane. The Status pane contains the following tab panes:
|