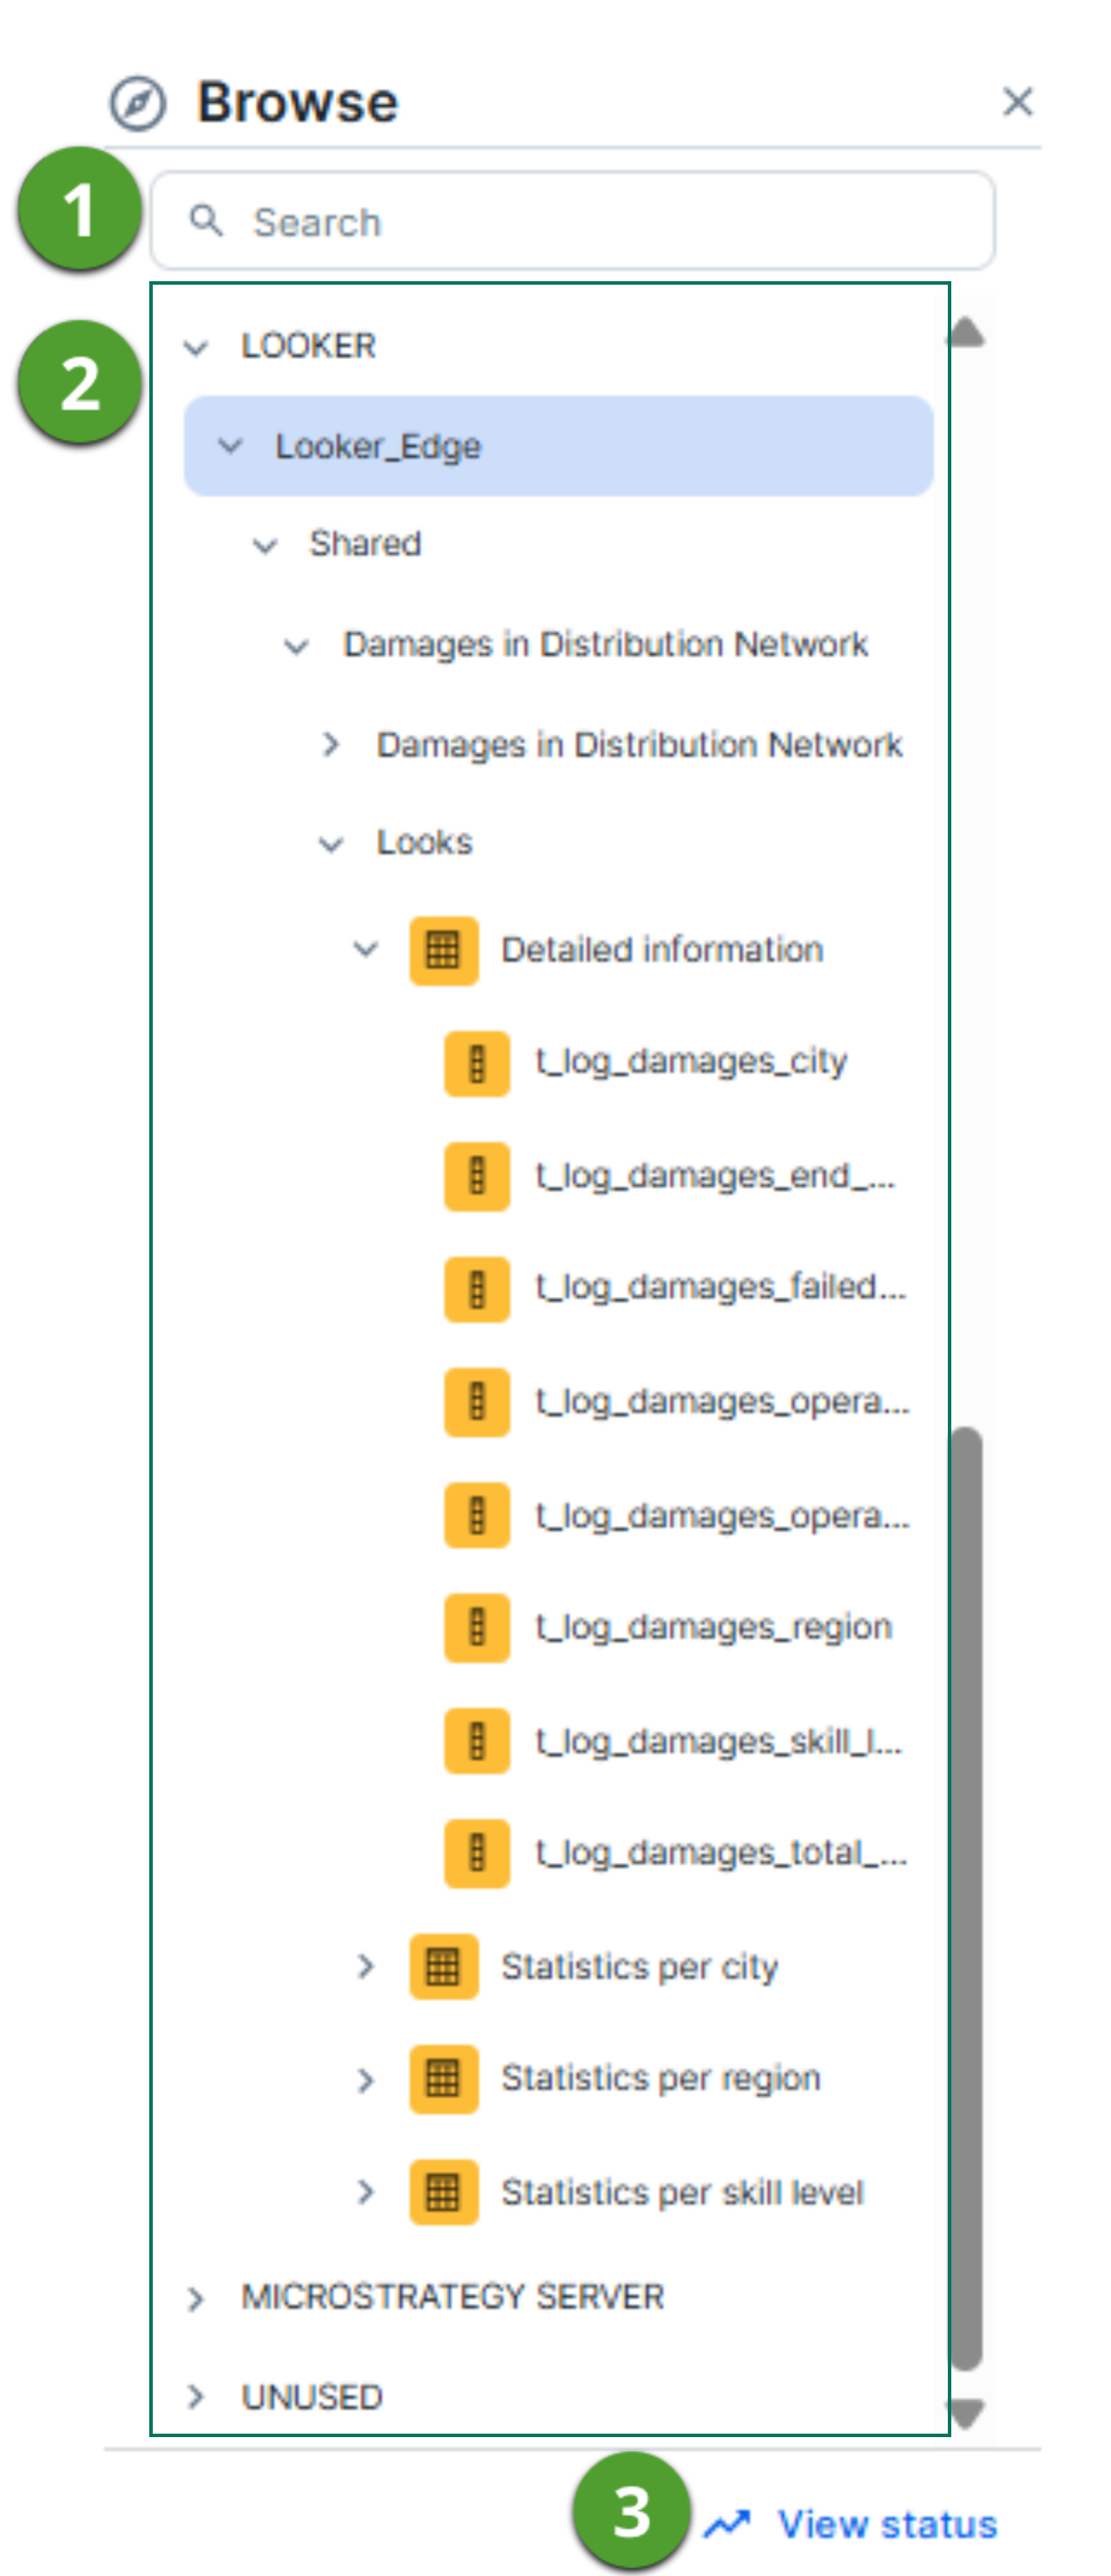
The Browse tab allows you to navigate to and search for a specific data object within the technical lineage tree.
The Browse pane allows you to navigate to and search for a specific data object within the technical lineage tree. Click the ![]() button on the toolbar to open or close the Browse pane.
button on the toolbar to open or close the Browse pane.

|
No |
Name | Description |
|---|---|---|
|
|
Search |
A search field that you can use to find a specific data object. You can enter a data object name to search for a data object. The technical lineage viewer performs a case-insensitive substring search. This means it returns any entry that contains the keyword, regardless of capitalization or position in the text. Example
When you search for dashboard, the following results might return:
|
|
|
Navigation tree |
A navigation tree in which you can search for specific data objects and visualize them in your technical lineage. The data objects are grouped by node type and have the following structure: system (if applicable) > database > schema > table > column. Note
|
|
|
|
The button to show the Status pane. The Status pane contains the following tab panes:
|


|
No |
Name | Description |
|---|---|---|
|
|
Search |
A search field that you can use to find a specific data object. Enter the name of a database, schema, table, or column. Searching for a system name is not supported. When you hover over the search field, a tool tip is displayed, which shows the available search methods:
|
|
|
All data objects |
A link to the complete technical lineage, showing all data objects in your data sources. |
|
|
Navigation tree |
A navigation tree in which you can search for specific data objects and visualize them in your technical lineage. The data objects are grouped by node type and have the following structure: system (if applicable) > database > schema > table > column. Note The list of data objects contains all systems, databases, schemas, tables and columns that were collected from the data sources by Collibra Data Lineage. If available, it also shows the technical lineage of BI sources, for example Power BI and Looker. In that case, the structure follows the existing structure in the BI source metadata. Note
|
|
|
Stats |
|

Understanding the Collibra system name setting
The Collibra system name setting, configured when you enable technical lineage via Edge, determines how databases are organized in the Browse
The following table shows how databases appear in the navigation tree based on the Collibra system name setting.
| Setting | Configuration | Result in Browse |
|---|---|---|
|
|
N/A | All databases are grouped directly under the DATABASE node. |
|
|
Correctly configured | Databases are grouped by their specific System Name. |
|
|
Incorrect configured or missing | Databases are grouped under a DEFAULT node. |
What DEFAULT means
DEFAULT appears when Collibra Data Lineage cannot map a database to a system name. This can occur when:
- The Collibra System Name field in the technical lineage capability is blank.
- For BI or ETL tools, the mapping is incomplete in the source configuration.
- The configured system name does not match the actual system name in your data source.
As a result, you may see some databases correctly organized under their system name while others are grouped under DEFAULT within the same technical lineage.
How to prevent databases from appearing under DEFAULT
To ensure that databases are grouped under their correct system name in the Browse pane, verify the following configuration:
- Ensure that the Collibra System Name field in the technical lineage capability is set to the correct system name.
- For BI and ETL tools, ensure that the source configuration includes a correct mapping.
For more information, go to Collibra system name.