Configure the landing page and Business dashboard

The AI Command Center landing page and Business dashboard leverage the Page Editor feature. Page Editor provides access to various components, such as sections and widgets, that you can use to customize pages and the dashboard. You can add your organization's branding, and add links to internal resources and your Collibra metrics.

Sections are full width preconfigured or customizable components. These include rows for widgets, page dividers, and preconfigured sets of data. Widgets are individual blocks that can be added to a row to show data or information, such as text, images, metrics, and links.

Prerequisites

To edit the landing page:

To edit the dashboard:

For complete information on how to configure the landing page and dashboard, and the components that are available to you, go to the Page Editor topics.

The AI Command Center registry is not customizable.

AI Command Center landing page

When you open AI Command Center, you arrive at the landing page. From the landing page, you have direct access to the AI Command Center dashboard and registry.

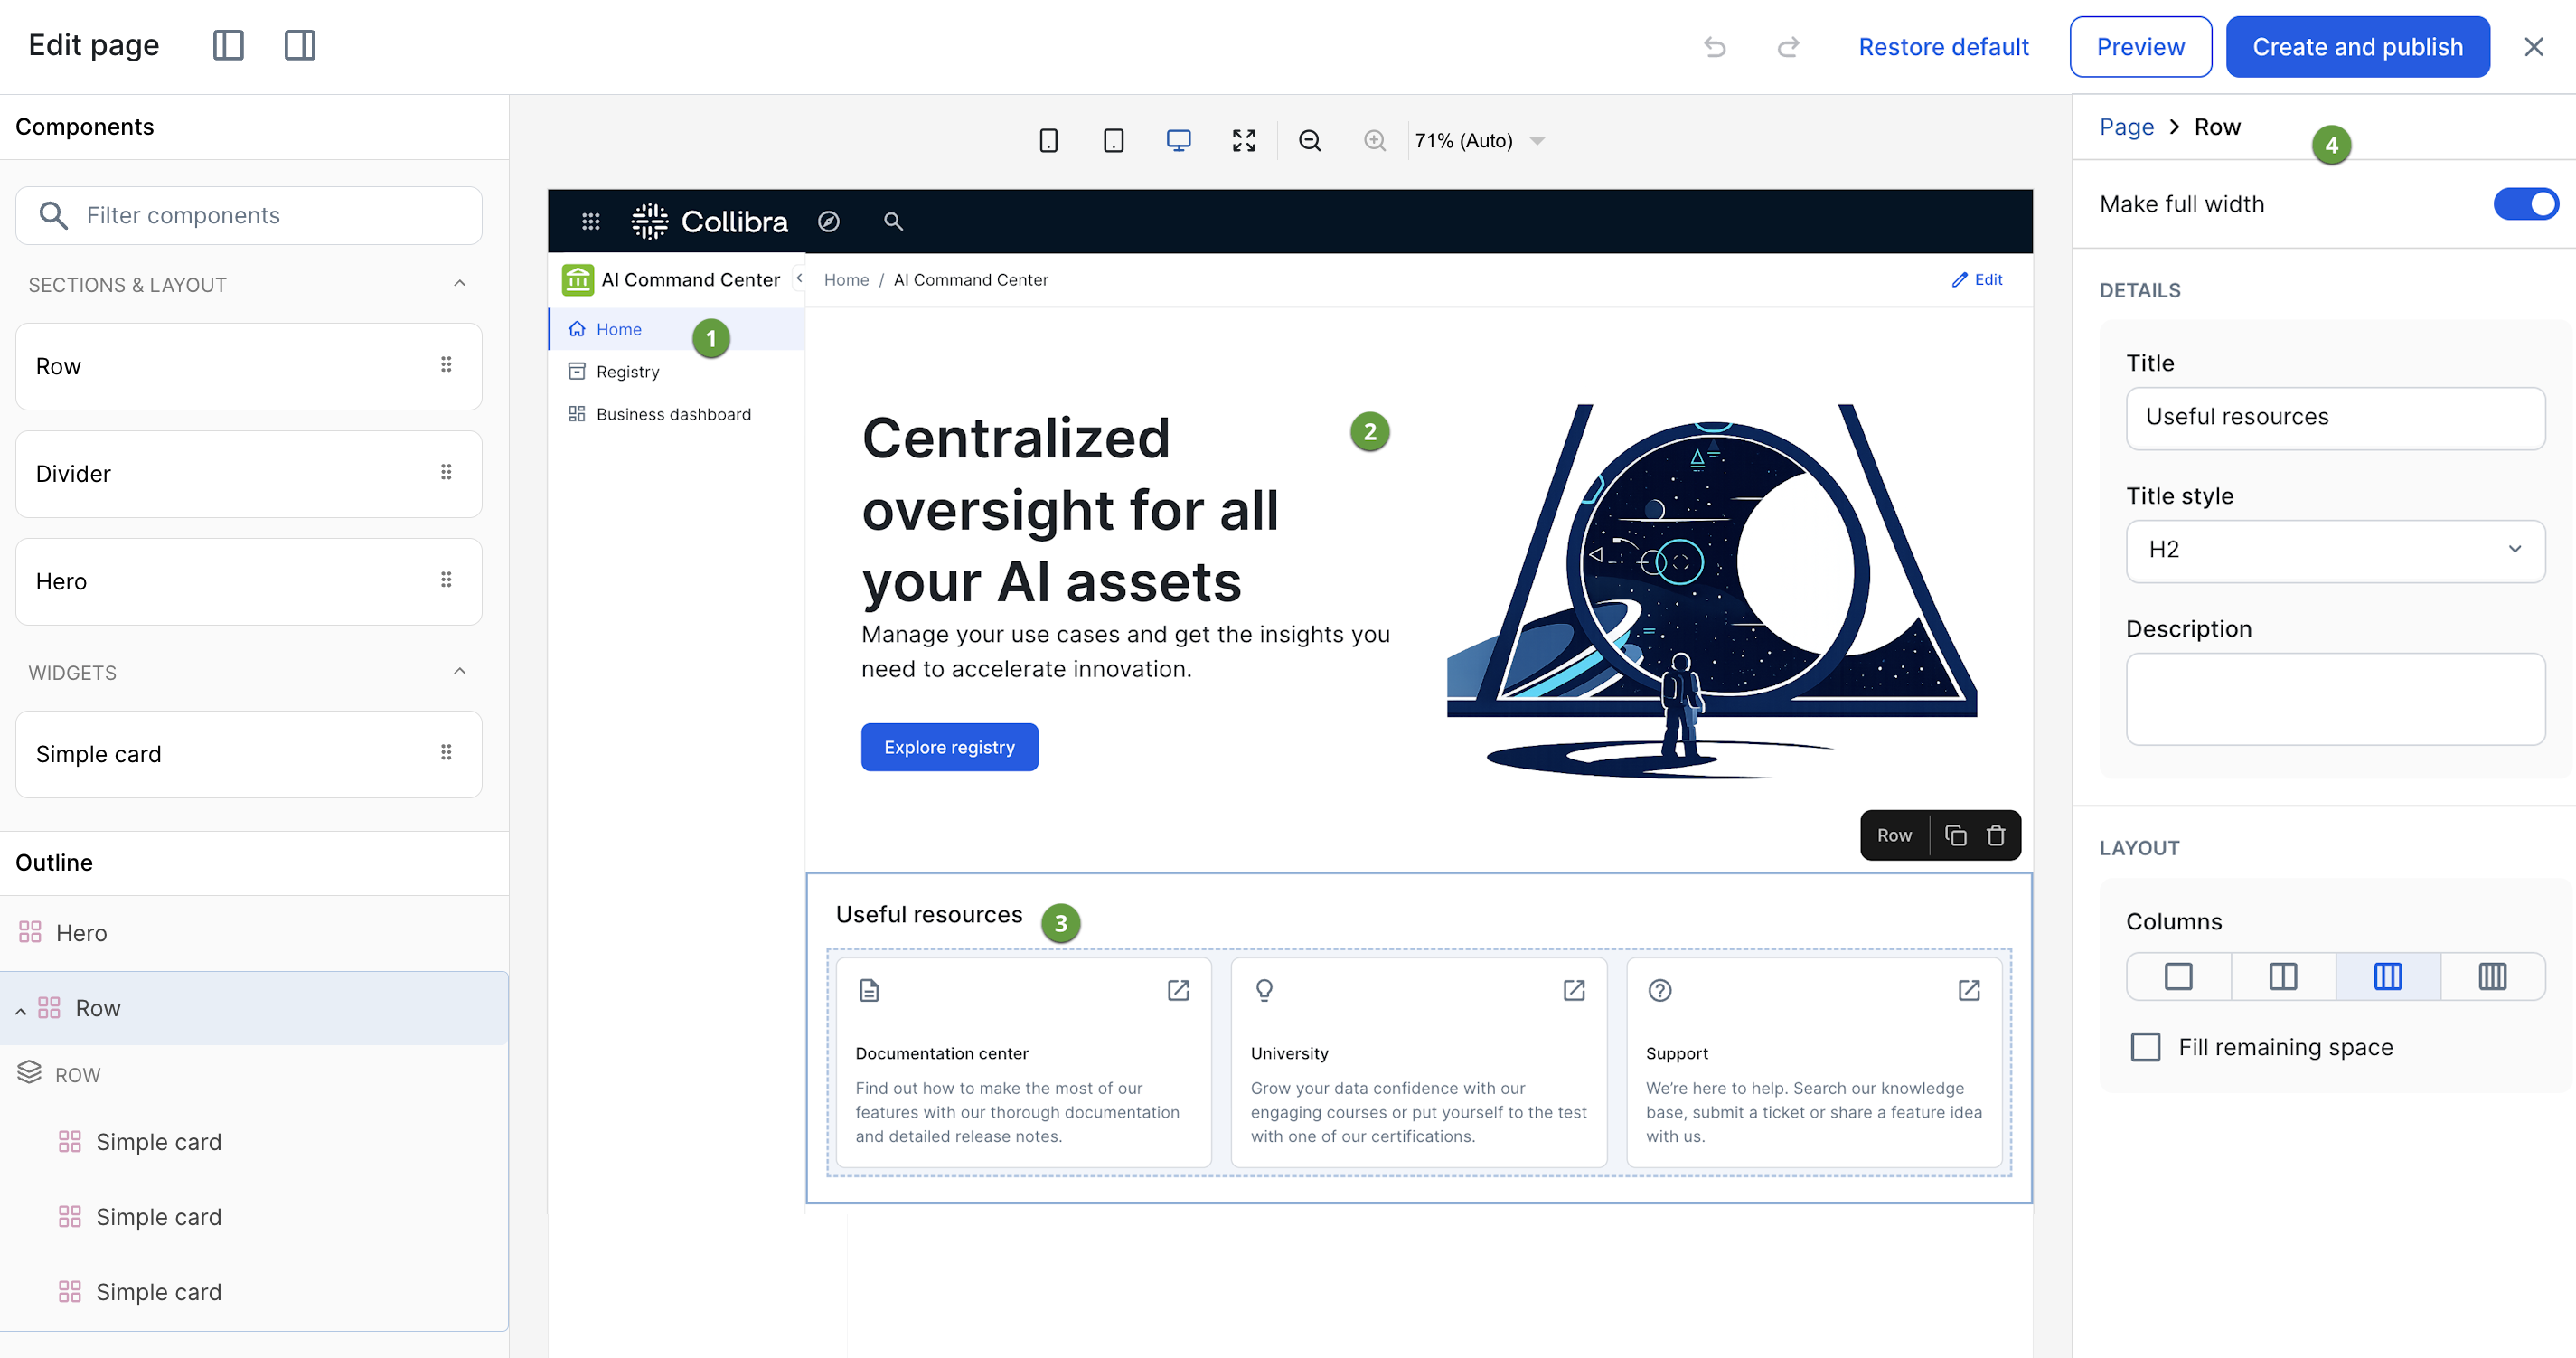
The following image shows the default landing page setup, in the editing state.

No. Component Description

number one

Sidebar navigation Tabs to access the AI Command Center landing page and the registry. These tabs are not customizable.

number two

Hero

The Hero section functions as a highly adaptable lead component, allowing for real-time adjustments to visual hierarchy, and ensuring the primary call-to-action remains dynamic and responsive.

number three

Recently viewed Allows you to quickly return to previously viewed AI assets without having to navigate via the registry.

number four

Useful resources The Resources section is a structured content grid designed for portal-style navigation. It uses a modular card system where administrators can define metadata, such as icons, descriptive text, and external links, within a locked layout that maintains design consistency while offering the flexibility to scale the number of support and educational links provided.

AI Command Center Business dashboard

The AI Command Center Business dashboard provides a centralized, real-time overview of your organization's AI landscape, aggregating high-level metrics to monitor performance, risk, and governance health.

The following image shows the default dashboard setup.

Note We might periodically add new rows or widgets to your dashboard. These additions will appear at the bottom of your dashboard and will not affect your existing layout or configuration.

No. Component Description

number one

Sidebar navigation Tabs to access the AI Command Center landing page and registry.

number two

Edit button

Allows administrators to configure the dashboard. For complete information, go to:

number three

Asset type filter

Allows you to define the scope of the data you are viewing on the dashboard.

You can select one or more, between AI Agent, AI Model, and AI Use Case asset types, and the data shown in the widgets adjusts to your selection. The dashboard treats them as a single combined pool for calculating the Avg. Trust Score and Lifecycle metrics.

The default state, meaning no asset types selected, is the same as selecting all three asset types. If you select AI models, both AI Model Version and AI Base Model assets are counted.

number four

Metric KPI widget

A configurable KPI tile. You can configure the widget to show one of the following metrics:

  • Trust Score: The average AI Trust Score of all AI assets in your Collibra environment, with consideration of any asset type filter selections.
  • AI agents: The total number of AI Agent assets in your environment.
  • Total CO2 emissions: The total estimated CO2 emissions from AI asset token consumption.

Number five

Assets by lifecycle status widget A bar chart that shows the number of assets of a specific type, per lifecycle stage.

Administrators can configure the widget for:

  • Agents (specifically, AI Agent and AI Agent Version assets)
  • Use cases (specifically, AI Use Case assets)

Only core phase asset statuses (lifecycle stages) are considered. For information about lifecycle stages and core phase asset statuses, go to About Lifecycle management and Configure the lifecycle stages for an asset type.

number six

Asset Distribution widget A donut chart that visualizes the distribution of assets by type, as a ratio of the total count.

number seven

Assets by risk rating widget

A bar chart that shows the number of assets of a specific type, per risk rating.

Risk ratings reflect the response to the "overall risk rating" question in the out-of-the-box Risks and Safeguards assessment.

number eight

Trust Score A heat map that correlates categories with qualitative ranges (Low, Medium, and High), to visualize asset density, per asset type, across different asset lifecycle stages.

The qualitative ranges reflect the AI Trust Score settings, which can be edited to reflect what matters most to your organization.

number nine

Risk Distribution widget

A matrix that cross-references use case risk levels with safeguard levels, to visualize the number of use cases at each risk-safeguard combination. Risk levels (High, Medium, and Low) are shown on the vertical axis, and safeguard levels (High, Medium, and Low) are shown on the horizontal axis.

Risk ratings reflect the response to the "overall risk rating" question in the out-of-the-box Risks and Safeguards assessment.