About the Job Details page
From this page, you can:
- Analyze your data quality and historical trends via the Profile tab.
- Ensure data quality scores and observations are accurate and reliable via the Monitors tab.
- View notification details via the Notifications tab.
- Troubleshoot execution issues via the Logs tab.
- View and manage who has access to a job via the Responsibilities tab.
- Rerun and edit the job.
- Add custom rules to the job.
Overview of the Job Details user interface
The Job Details page allows you to assess the status of your data quality operations at a glance. The following image and sections describe the key functional areas of the page.
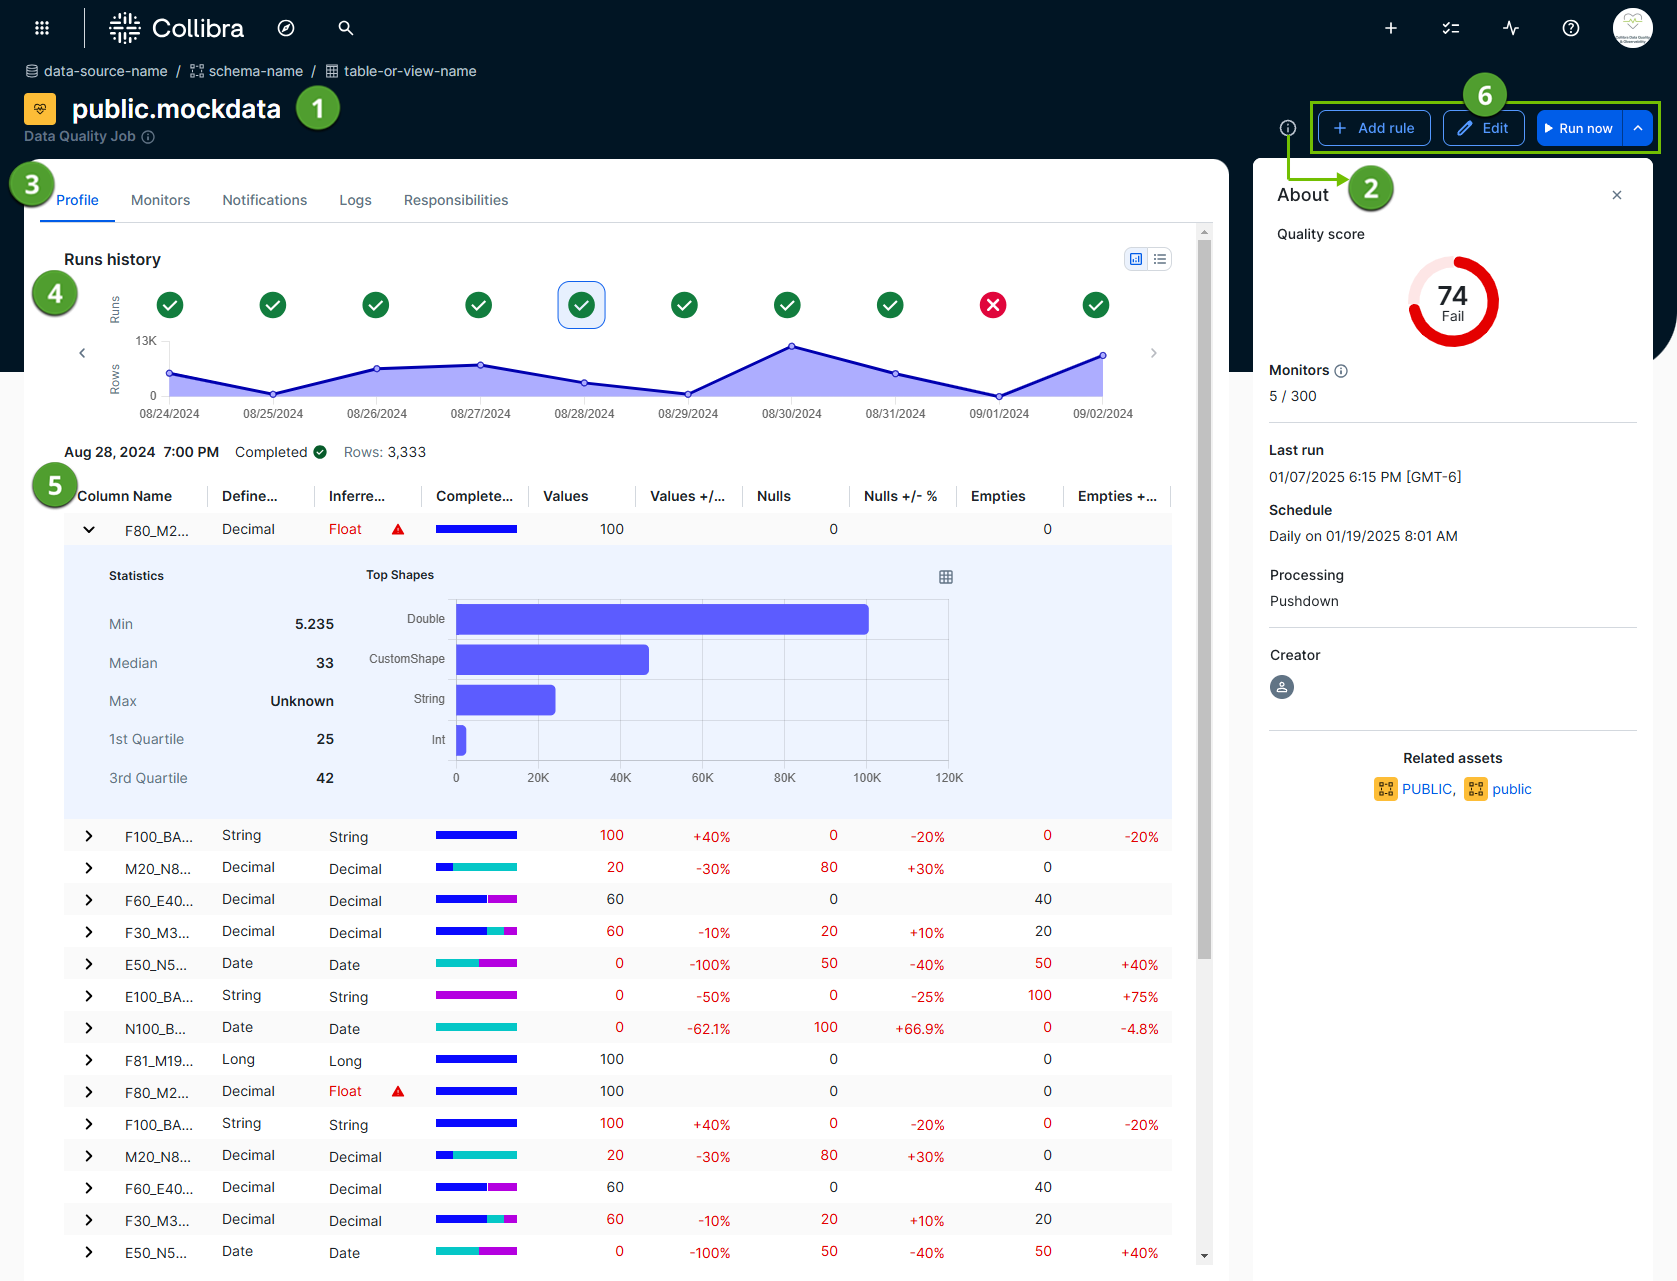
Job identification and summary
The top of the page and the About sidebar provide the context you need to identify the job and its essential attributes.
- Job header (
 ): Shows the name of the job and a breadcrumb trail of its origin (data-source-name / schema-name / table-or-view-name).
 - About sidebar (
 ): A collapsible sidebar that provides a brief overview of important components of a job, including:
- Quality score: The data quality score of a job, aggregated over all historical runs.
- Monitors: The number of passing monitors divided by the total number of active monitors.
- Last run: The timestamp of the last run of a job. This uses a YYYY/MM/DD hh-mm [time zone] format. The time and time zone are only shown when the run date format is a datetime or timestamp. They are not shown when the run date format is a date.
- Schedule: The days when a job is set to run automatically. When a job is not scheduled, a "Not scheduled" message is shown.
- Processing: The method that the data quality capability uses to process jobs. For example, the Data Quality Pushdown Processing capability uses Pushdown processing, and is therefore shown as Pushdown in this section.
- Creator: The name of the user who created the job.
- Related assets: The schema assets related to a job.
Data profile, monitoring, and analysis tools
Use the central Profile, Monitors, Notifications, Logs, and Responsibilities tabs ( ) to switch between different views of a job run. Depending on whether you are on the Profile, Monitors, or Logs tab, you see the following:
- Run history (
 ): Depending on the selected tab, the run history chart shows the history of up to 10 previous job runs. When a job has more than 10 runs, click
  to see the history of the previous 10 job runs. Click any previous job run in the chart to drill down into its details. You can use this chart to spot trends, such as:
- Quality score degradation
- Breaking records per run
- Row count changes
- Job run completion and duration
- Data table (
 ): The table below the charts provides granular details, such as specific data quality observations or line-by-line logging events for troubleshooting.
Job management actions
The job management options ( ) in the upper-right corner of the page allow you to perform various job-level actions, including:
- Run now and Run selected: You can use the Run now option to manually queue a new job run, based on the existing specifications of your job. When a historical job run is selected in the run history chart, you can rerun the job on that date by clicking
 , then Run selected.
 - Add rule: Open the Rule Workbench to add custom SQL rules to your job.
- Edit: Open the stepper to edit your job configuration.