About data quality monitors
Data quality monitors allow you to:
- Track the evolution of your data quality score over time.
- View the specific number of findings per job run.
- Gain valuable insights to support your business decisions.
Data quality monitors are out-of-the-box or user-defined SQL queries that provide observational insights into the quality and reliability of your data. Each out-of-the-box monitor is associated with a default data quality dimension. You can also associate user-defined SQL queries with data quality dimensions. Data quality dimensions categorize data quality findings to help communicate the types of issues detected.
For a job to have monitors, it must include one or more rows of data. If a job runs with zero rows, no monitors are executed, and they do not appear on the Monitors tab. The row count out-of-the-box monitor is the first monitor evaluated during a job run. If no rows are found, the remaining monitors are bypassed because they require rows in the job to function. All out-of-the-box monitors need at least four job runs with one or more rows before they can provide suggestions on whether they are breaking or passing. Until this condition is met, the row count monitor remains in the learning state.
Overview of the Monitors tab user interface
The Monitors tab allows you to assess the health of your data quality operations at a glance. The following image and sections describe the key functional areas of the page.
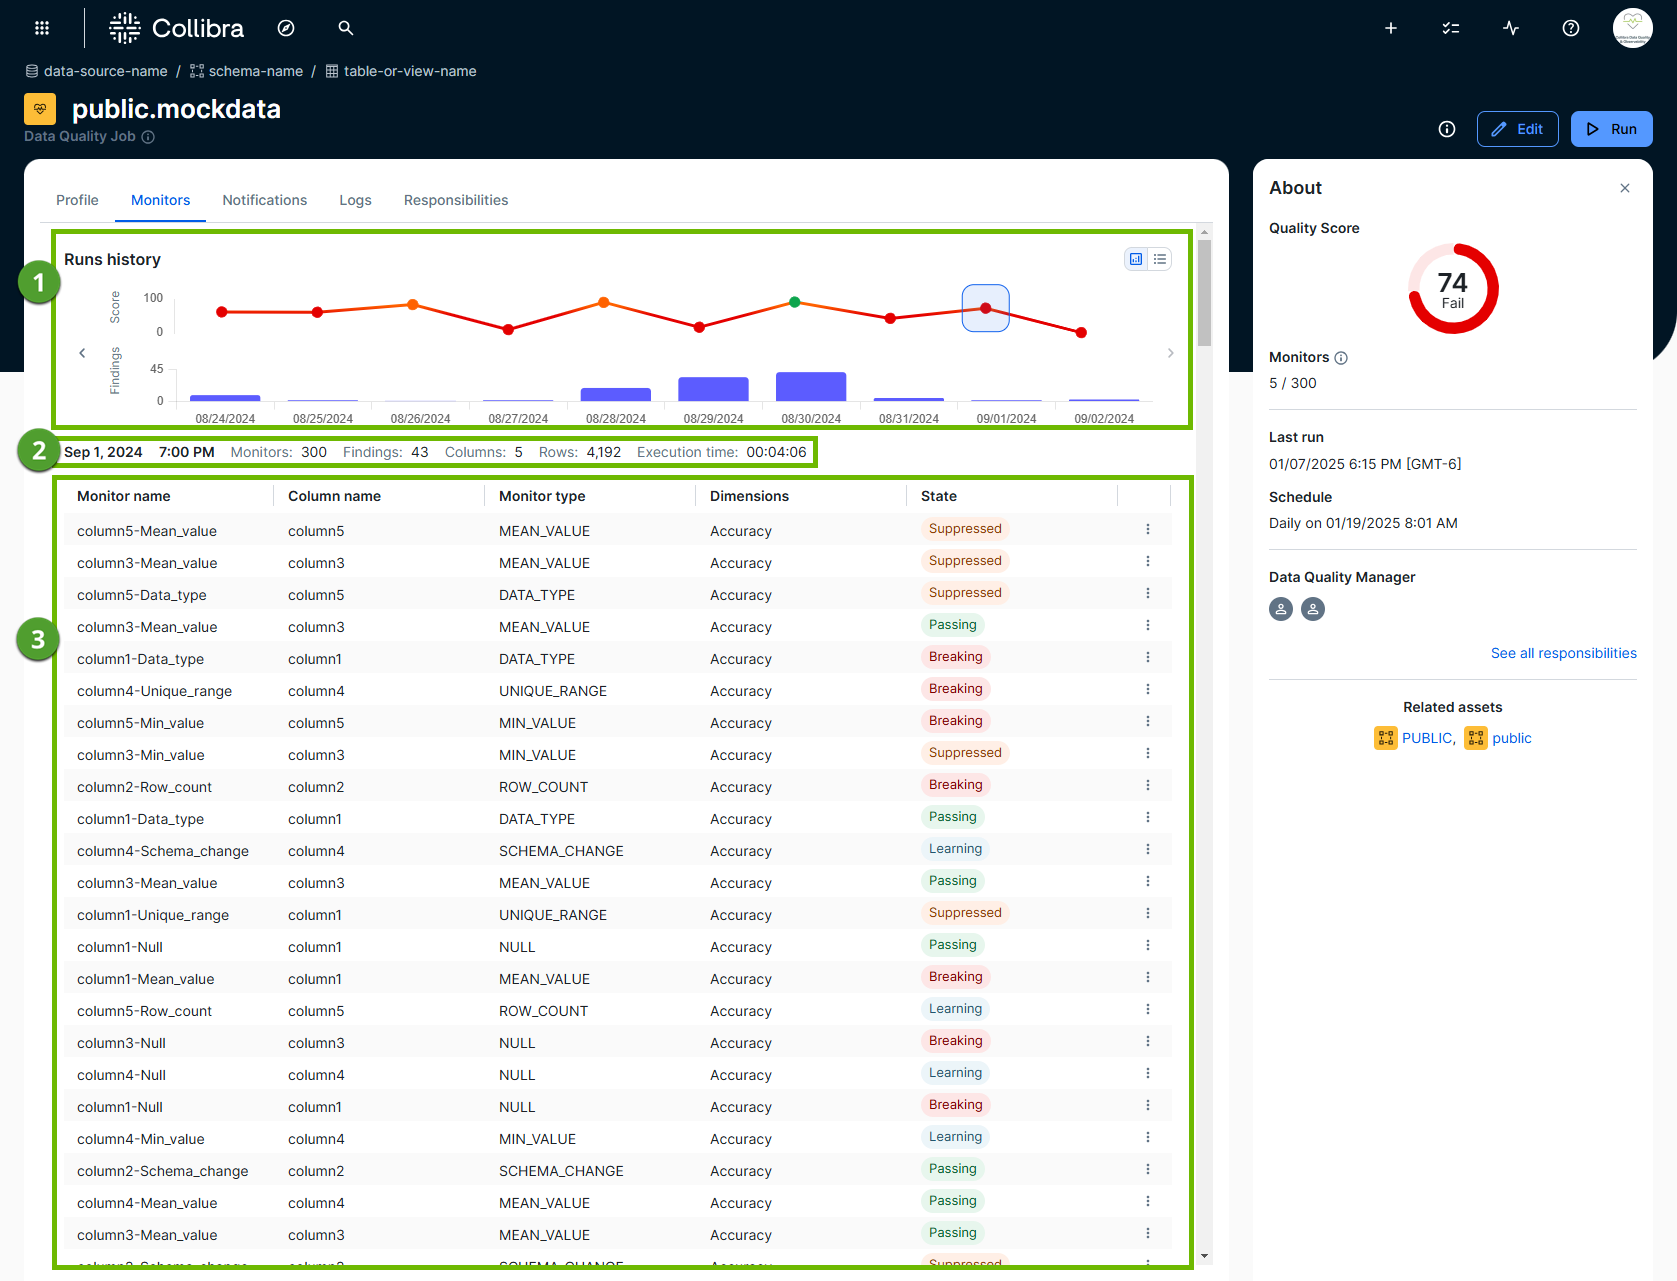
Run history
Run history ( ) shows the data quality score and number of findings from a job run on a given day. You can view these details in a chart or list display.
Tip Hover your pointer over a point on the data quality score line chart to view the exact score and run date, or click the point to open the monitors of any run on its associated date.
Run metadata
The run metadata section ( ) contains various metadata of a job run.
Run metadata shows:
- The date and time of a job run. The time is only shown when the run date format is a datetime or timestamp. It is not shown when the run date format is a date.
- The number of active monitors on a job.
- The number of breaking monitors identified during the job run.
- The number of columns in the job.
- The number of rows in the job.
- The total amount of time the job took to run.
Monitor details table
The monitor details table ( ) shows the output of each monitor. It includes insightful details, such as monitor type, the data quality dimension associated with each monitor, and its status. For more information, go to the overview of monitor details table.
The following table provides an overview of the monitors shown on the Monitors tab.
| Monitor type | Description |
|---|---|
| Monitor name | The name of the monitor. |
| Column name | The name of the column. |
| Monitor type |
The type of monitor that actively checks for changes in a Data Quality Job. Out-of-the-box monitors
User-defined monitors
|
| Dimensions |
The data quality dimension associated with the monitor type. While you can create custom dimensions, the following list includes the out-of-the-box data quality dimensions.
|
| State |
When a monitor is active, the following states are possible.
When a monitor is not active, the Suppressed state is possible.
Note The state of a rule is not visible until you run the job. |
| Actions |
Depending on the type and state of the monitor, you can:
Important To train monitor results, you need a global role with the Product Rights > Data Quality global permission or the Data Quality Editor or Data Quality Manager resource role with the Data Quality Job > Train Monitors resource permission. |
Behavior of monitors when a job runs without data
When a job runs with zero rows, the monitors react differently based on their current state (learning or active).
Learning phase threshold
The adaptive rules learning model requires a completed run with at least one row of data to begin the learning process. If a job runs with zero rows, the system does not count those runs toward the minimum threshold required to exit the Learning state. If a job has prior consecutive zero-row runs, the first run that contains data does not show an adaptive rule status. The status appears only after the system processes a subsequent run that contains data.
Row count monitor
The row count monitor shows zero rows detected.
Scoring and status
The resulting scoring and status of the monitors depend on whether the monitor is in the learning state or is already active:
| State | Monitor status | Adaptive rule status | Scoring logic |
|---|---|---|---|
| Learning |
The row count monitor passes. |
Other adaptive rules show the status “exception”. | The score is 100% (1 learning monitor / 1 active monitor). |
| Active |
The row count check runs first. The monitor status is based on the expected range. If the expected range includes 0, the monitor passes. If 0 is outside the expected range, the monitor shows a breaking status. |
Other adaptive rules show the status “exception”. | Monitors showing "exception" or "suppressed" are not included in the denominator for score calculation. |