About the data profile
When you run a Data Quality Job, the scan results include rich insights such as column-level statistics, charts, and other data quality and observability metrics. These insights help you identify common patterns and emerging trends, offering a better understanding of your data's structure and contents.
Overview of the Profile tab user interface
The following image and sections describe the key functional areas of the Profile tab.
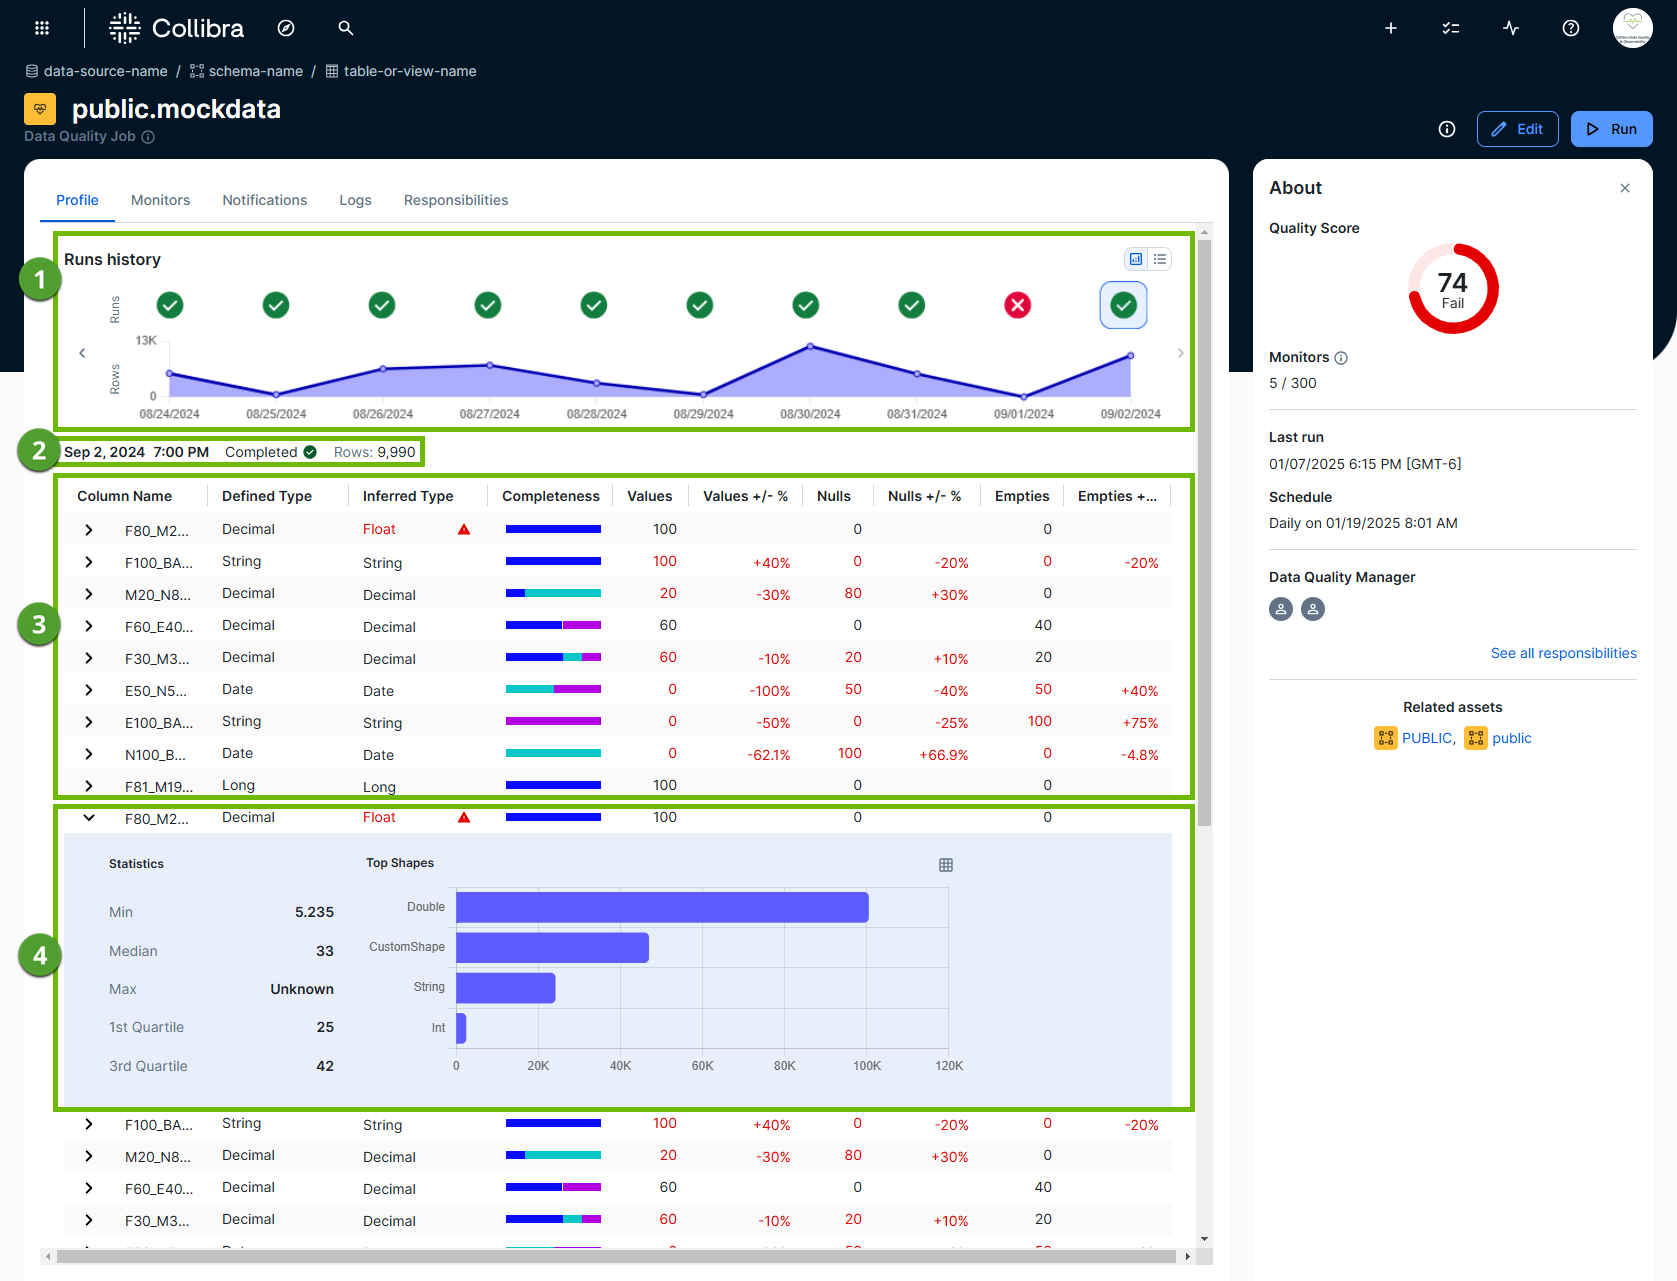
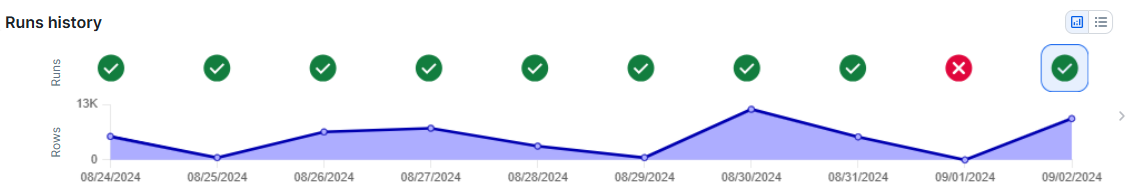
Run history
Run history ( ) shows high-level data profiling details from each run of a job in a chart or list display. These details include:
- The completion or failing status of a given run.
- The row count evolution.
- The date of a run.
Tip You can click the passing or failing status icon to open the data profile of any run on its associated date.
Run metadata
Run metadata ( ) provides important context about a given run. Run metadata shows:
- The date and time of a job run. The time is only shown when the run date format is a datetime or timestamp. It is not shown when the run date format is a date.
- The completion or failure status of a run.
- The number of rows in the job.
Data profile statistics
The data profile statistics table ( ) captures the observations for each column following a job run. The table shows the following column statistics:
- Column Name
- Defined Type
- Inferred Type
- Completeness
- Values and Values +/- %
- Uniques and Unique +/- %
- Nulls and Nulls +/- %
- Empties and Empties +/- %
Descriptive column profile statistics
In the data profile statistics section ( ), you can expand any row to view the descriptive profiling statistics of a column.
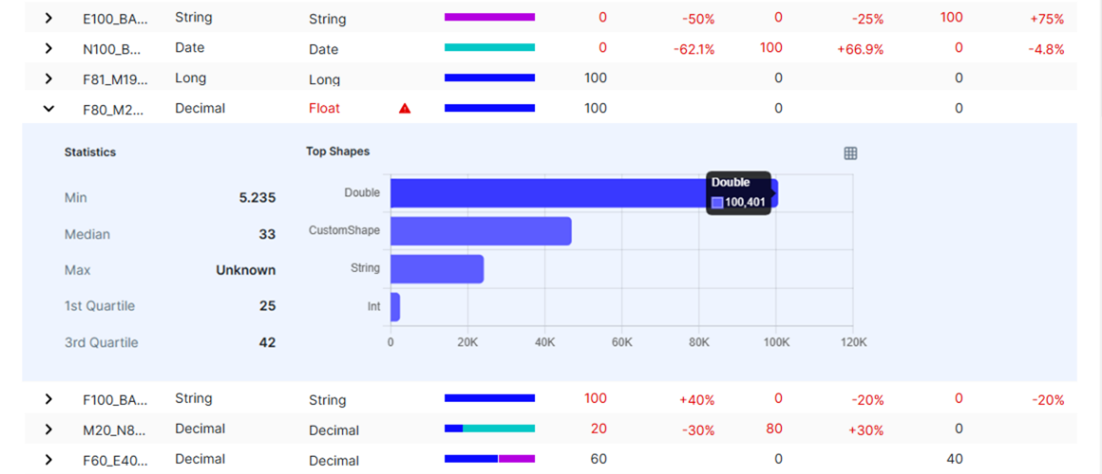
The expanded view provides the following column-level statistics:
- Min/max
- Median
- 1st quartile
- 3rd quartile
Additionally, Top Shapes shows the string data type cell values that appear the most and least frequently in the column. This information helps you identify inconsistent data types or unexpected string values, recognize frequently recurring patterns, and understand the distribution of data in the column.
Behavior of data profiling when a job runs without data
When a job runs with zero rows, the Profile tab continues to show column names and defined data types. However, all profile statistics fields, including minimum, maximum, frequency counts, and the completeness chart, show a null state marked with a hyphen (-) to indicate that the run has no data (zero or fewer rows).
Data profiling statistics
The following describes the data profiling statistics captured in the table on the Profile tab.
| Column | Description | Calculation | ||||||||||||||||||||||||||||||||||||||||||||||||||
|---|---|---|---|---|---|---|---|---|---|---|---|---|---|---|---|---|---|---|---|---|---|---|---|---|---|---|---|---|---|---|---|---|---|---|---|---|---|---|---|---|---|---|---|---|---|---|---|---|---|---|---|---|
| Column Name | The name of the column whose data profile statistics are represented in the same row in the data profile table. | N/A | ||||||||||||||||||||||||||||||||||||||||||||||||||
| Defined Type |
The data type of a column when the table was created. Data types: Categorical and numeric |
The data type is extracted directly from the database. Possible values include:
|
||||||||||||||||||||||||||||||||||||||||||||||||||
| Inferred Type |
The data type of a column that Collibra observes as possible deviations from the defined type. If a column does not contain a potential deviation, the data type matches the defined type. Data types: Categorical and numeric |
The actual data type is mapped to an inferred data type. The table below shows the mapping of the various data types.
|
||||||||||||||||||||||||||||||||||||||||||||||||||
| Completeness |
The percentages of unique and missing values in a column. A chart shows the distribution of unique, null, and empty value percentages in a column. Hover your pointer over the chart to show the exact percentages. Data types: Categorical and numeric |
Null:
SELECT ROUND(COUNTIF(TRIM(<column_name>) = ‘ ‘)) / COUNT (*)*100,3) AS null_percentage FROM <dataset>
Empty:
Mixed:
|
||||||||||||||||||||||||||||||||||||||||||||||||||
| Values |
The number of values in a column that are not null or empty. Data types: Categorical and numeric |
SELECT COUNT(DISTINCT <column name>) FROM <dataset>
|
||||||||||||||||||||||||||||||||||||||||||||||||||
| Values +/- % |
The percentage increase (+) or decrease (-) of rows with unique values since the previous run. |
N/A | ||||||||||||||||||||||||||||||||||||||||||||||||||
| Uniques |
The number of distinct values in a column, including nulls and empties. This is also known as cardinality. This can help you understand whether the values in a column continue to be unique, or if it contains the same values. For example, the expectation of an "ID" column might be that all values should be unique, whereas the expectation of a "date" column might be that all values should be the same. Data types: Categorical and numeric |
SELECT COUNT(DISTINCT <column name>) FROM <dataset>
|
||||||||||||||||||||||||||||||||||||||||||||||||||
| Unique +/- % |
The percentage increase (+) or decrease (-) of rows with unique values since the previous run. |
N/A | ||||||||||||||||||||||||||||||||||||||||||||||||||
| Nulls |
The number of rows without any values. Data types: Categorical and numeric |
SELECT ROUND(COUNTIF(<column_name> IS NULL)) FROM <dataset>
|
||||||||||||||||||||||||||||||||||||||||||||||||||
| Nulls +/- % |
The percentage increase (+) or decrease (-) of rows in a column without any values since the previous run. |
N/A | ||||||||||||||||||||||||||||||||||||||||||||||||||
| Empties |
The number of rows for which the string lengths are zero. Data types: Categorical and numeric |
SELECT ROUND(COUNTIF(TRIM(<column_name>) = ‘ ‘)) FROM <dataset>
|
||||||||||||||||||||||||||||||||||||||||||||||||||
| Empties +/- % |
The percentage increase (+) or decrease (-) of rows in a column for which the string lengths are zero since the previous run. |
N/A |
Column-level statistics drill-down
The following table describes the statistics that are shown when you drill down into a column on the data profile table.
| Statistic | Description | Calculation |
|---|---|---|
| Min/max |
The smallest and largest values in a column. Data type: Categorical and numeric |
SELECT min(<column_name>) AS min, max(<column_name>) AS max FROM <dataset>
|
| Median |
The value that represents the 50th percentile of the values in a column, below which, 50% of the data falls. Data type: Numeric |
SELECT PERCENTILE_CONT(0.5) WITHIN GROUP (ORDER BY <column_name> AS first_quartile
FROM <dataset>
|
| 1st Quartile |
The value that represents the 25th percentile of the values in a column, below which 25% of data falls. Data type: Numeric |
SELECT PERCENTILE_CONT(0.25) WITHIN GROUP (ORDER BY <column_name> AS first_quartile
FROM <dataset>
|
| 3rd Quartile |
The value that represents the 75th percentile of the values in a column, below which 75% of data falls. Data type: Numeric |
SELECT PERCENTILE_CONT(0.75) WITHIN GROUP (ORDER BY <column_name> AS first_quartile
FROM <dataset>
|