Manage Page Editor Data Quality widgets
The Data Quality widgets help you track key metrics, such as monitoring coverage, job run status, and data quality scores.
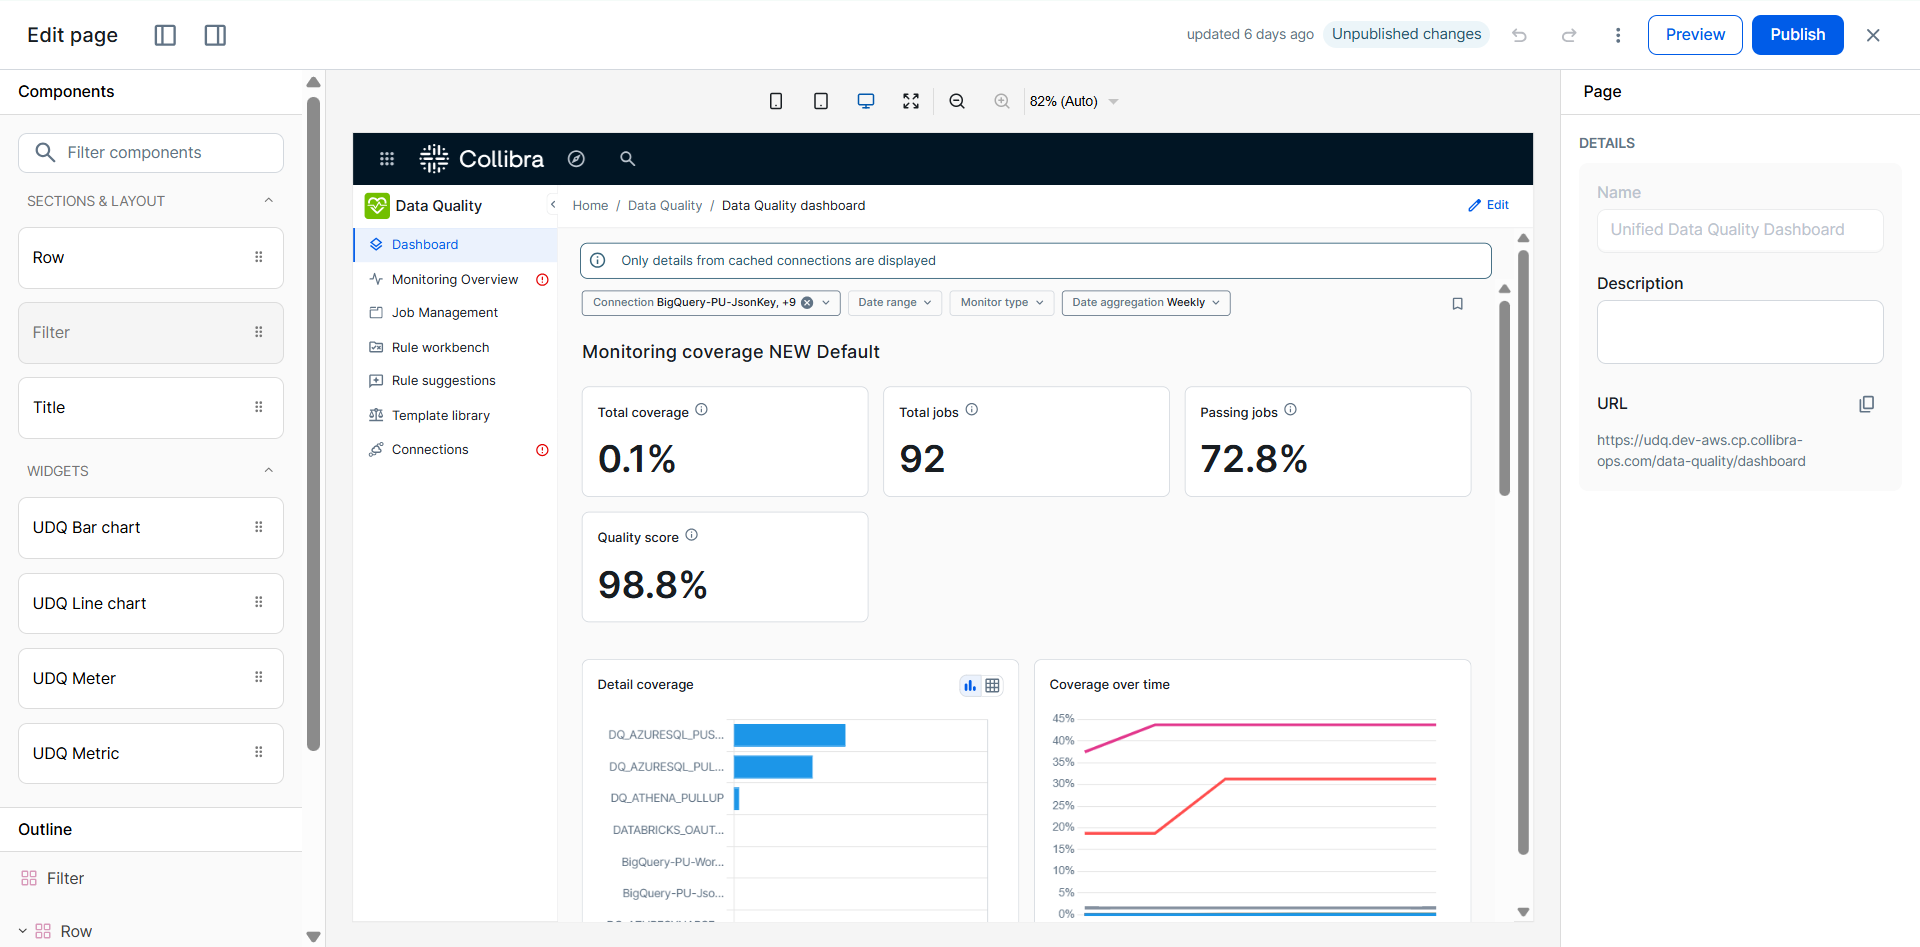
Data Quality widgets
The following table describes the Data Quality widgets.
| Widget | Description |
|---|---|
| UDQ Bar chart |
Shows the percentage of tables with active DQ jobs with counts of tables monitored vs total tables. |
| UDQ Line chart |
Shows the volume and status of running jobs over time to identify load issues or failures. |
| UDQ Meter |
Shows the overall quality score broken down by dimension to understand data weaknesses. |
| UDQ Metric |
Shows statistics about the overall health and maturity of your data. |
Prerequisites
You have the required permissions to edit the product page or dashboard.
Steps
- Go to the Data Quality dashboard:
- On the main toolbar, click
 >
Data Quality.
>
Data Quality. - In the left pane, click Dashboard.
- On the main toolbar, click
- Click Edit.
- Place the widget:
- If this is a new widget, under Widgets, drag and drop the widget to the desired row on the dashboard.
- If this is an existing widget, drag and drop the widget to the new position on the dashboard.
- Select the widget you want to configure.
- In the right pane, update the widget details:
- In the Title field, enter the name of the widget.
- In the Description field, enter a description of the widget.
- Select the Show description in a tooltip checkbox to show the description in a tooltip. This helps consolidate space on your page.
- Enter the widget-specific details. See Data Quality widgets above for more information.
- Select how often you want the widget data to be refreshed in the Refresh interval.
- Toggle on the Remove border and padding field to reduce the padding around the widget.
- Optionally, select
 above the component to copy and paste the component.
 - Optionally, select
 above the component to delete the component.
 - Click Publish to publish your changes.