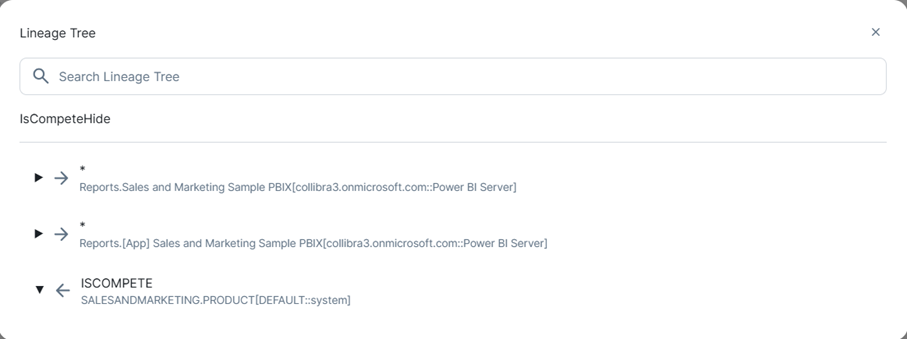
The technical lineage graph consists of nodes and edges. Each node represents a corresponding object in a data source. Each edge shows a relation between nodes.
Nodes and edges in the technical lineage graph show how data flows from source to destination. A clearer understanding of nodes and edges enhances your technical lineage experience.
Consider the following visual elements in the technical lineage graph:
- Relation types
- Messages
- Colors
- Icons
- Arrows
- Collapsed attributes menu
- Right-click menu
- SELECT statements that result in "-RES" tables in the lineage
Relation types
The technical lineage graph shows relations between columns in the graph. Collibra Data Lineage creates and shows the following relation type between stitched assets and other data objects:
|
Head |
Role |
Co-role |
Tail |
Public ID |
|---|---|---|---|---|
|
Data Element |
targets |
sources |
Data Element |
DataElementTargetsDataElement |
Messages
The technical lineage graph might show different messages to alert you. The following messages are the most common:
|
Message |
Description |
|---|---|
| No object found, try using a wildcard % |
When a data object name was entered in the search field on the Browse tab pane, this message is shown if the data object does not exist or a system name was entered. The following rules apply when you search for a data object:
Note Search is not supported in the UNUSED section. This message is shown if you search for a data object that is in the UNUSED section.
|
|
The technical lineage graph exceeds the limit of 350 nodes or 1,000 edges and is too large to display. This happens, for example, if you have a table with many columns and you try to show the technical lineage of all columns in a table in one graph. Note You cannot manually change this limit. |
|
| Depth was auto-adjusted to <number>. Graph was too large to display at once. |
The technical lineage graph exceeds the edge limit, which results in the automatic adjustment of the flow depth for the graph. The adjusted depth value is determined by the number of the edges that exceed the maximum edge limit. When the flow depth is automatically adjusted to a lower value than the actual graph size, you can find the |
| The current asset doesn't have a technical lineage yet. |
This message is shown if you didn't create a technical lineage for the data source of the asset. Use the Browse tab pane to navigate through the data object for which a technical lineage graph is available. |
| Technical lineage cannot be shown. |
The technical lineage graph cannot be shown, because there are too many data objects. This happens, for example, when you created a technical lineage for multiple data source and you click All data objects in the Browse tab pane. Use the Browse tab pane to view specific parts of the technical lineage graph or click the suggested data objects to see their graph. |
Colors
The technical lineage graph shows different colors to indicate which data objects are stitched to assets in Data Catalog and which are not.
Background colors
The background color of a node indicates whether or not the data object was stitched to an asset in Data Catalog, and whether something went wrong.
A node has one of the following background colors:
|
Color |
Description |
|---|---|
|
Yellow |
Data objects from your data source that are stitched to assets in Data Catalog |
|
Gray |
Data objects, for example temporary tables and columns, that Collibra Data Lineage collects from your data sources, but are not stitched to assets in Data Catalog. |
|
Red |
Attributes that are automatically assigned to a data object, because of missing DDL statements. If you want to remove objects with a red background, change the statements and rerun the lineage harvester (deprecated) or synchronize the technical lineage again if you use technical lineage via Edge. |
Since a technical lineage shows how data flows from source to destination, it is possible to see a lineage graph with yellow, red, and gray nodes.

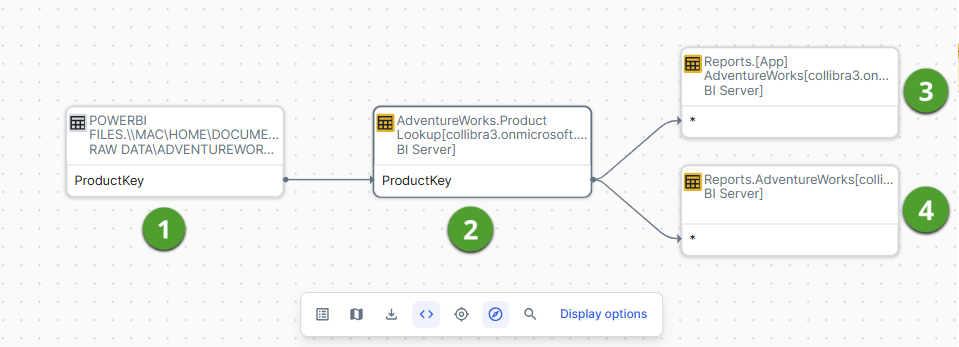
The background color of a table icon in a node indicates whether or not the data object was stitched to an asset in Data Catalog.
An icon has one of the following background colors:
|
Color |
Description |
|---|---|
|
Yellow |
Data objects from your data source that are stitched to assets in Data Catalog |
|
Gray |
Data objects, for example temporary tables and columns, that CollibraData Lineage collects from your data sources, but are not stitched to assets in Data Catalog. |
Since a technical lineage shows how data flows from source to destination, it is possible to see a lineage graph with yellow and gray nodes.
Font colors
The font color of a data object in the technical lineage graph indicates whether there is a relation between this data object and one or more other data objects.
A node has one of two font colors:
Example The following technical lineage graph shows three nodes. The node 1 contains data objects that have no incoming or outgoing edges to other data objects in the technical lineage. Nodes 2 and 3 only contain data objects that have a relation to other data objects in the technical lineage.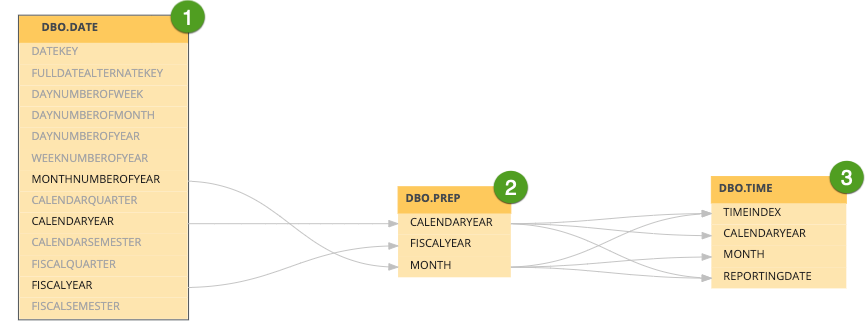
Icons
Collibra uses various icons in the technical lineage graph.
Collibra uses the following icons in the technical lineage graph.
|
Icon |
Description |
|---|---|
|
|
The name of a table was found by the transformations code search in the source code on which the analysis failed. Consequently, the lineage flow of the table is probably incomplete. If you click Show failed SQLs on the right click menu of the table, the failed SQL queries appear in the transformations viewer at the bottom of the page. |
|
|
A relation for the data objects exists, but it isn't shown, for example because you set the technical lineage flow depth to a lower value than the actual graph size. |
|
Icon |
Description |
|---|---|

|
The name of a table was found by the full-text search in the source code on which the analysis failed. Consequently, the lineage flow of the table is probably incomplete. If you click Show failed SQLs on the right click menu of the table, the failed SQL queries appear in the source code pane at the bottom of the page. |

|
The lineage is cyclic, for example A → B → C → A. It only appears if you enabled the only ending points option in the Settings tab pane. |
|
|
A relation for the data objects exists, but it isn't shown, for example because you set the technical lineage flow depth to a lower value than the actual graph size. |
Example The following Technical lineage graph shows two nodes. The first node has an icon to indicate that the lineage flow you currently see is probably incomplete. The second node has three data objects that have a relation to other data objects, but the edges that represent that relation are not shown.![]()
Arrows
Arrows are incoming or outgoing edges that show how the data flows from source to destination. They represent relations of the type "Data Element sources / targets Data Element".
There are two ways in which an arrow can be shown:
|
Arrow type |
Description |
|---|---|
|
Single |
Shows the full lineage without skipping certain data objects. |
|
Dot |
Shows that there are hidden data objects in the technical lineage graph. This happens when only the endpoints of the technical lineage flow are shown. |
Example The following Technical lineage graph shows the edge with a dot, which indicates that there are other nodes between these nodes in the full technical lineage flow.
|
Arrow type |
Description |
|---|---|
|
Single |
Shows the full lineage without skipping certain data objects. |
|
Dot |
Shows that there are hidden data objects in the technical lineage graph. This happens when only the endpoints of the technical lineage flow are shown. |
Collapsed attributes menu
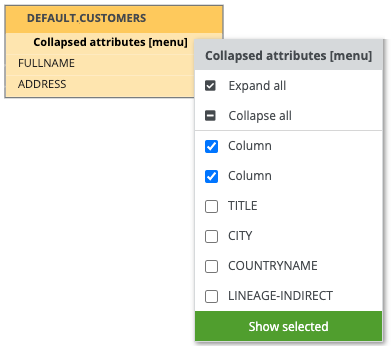
If you select a specific column in a table that contains multiple columns, you can choose to display all other columns or only the selected columns in the same table:
- Click the more button (
) and select Collapsed attributes.
A windows opens showing a list of columns. - Select one of the following options:
- Expand all and click Apply to display all columns in the table
- Select individual columns and click Apply to display only the selected columns.
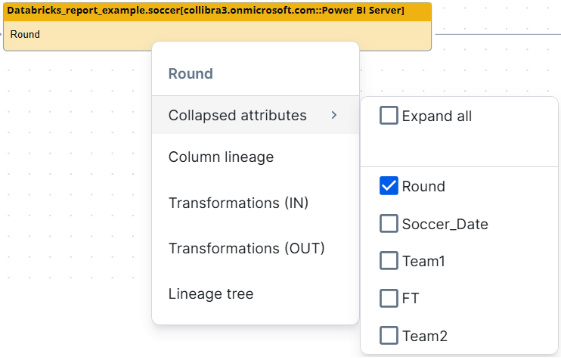
If you select a specific column in a table with multiple columns, you can right-click the column and hover over Collapsed attributes to show all other columns or only the selected columns in the same table.
Right-click menu
If you right-click a node
)
|
Functionality |
Description |
|---|---|
| Collapsed attributes | This action is available when the table contains multiple columns. You can choose to display all other columns or only the selected columns in the same table. For details, go to Collapsed attributes menu. |
| Column/Table lineage | Switch to the technical lineage graph of the selected column or table. |
| Transformation (IN) |
Show the transformation logic of the incoming source code fragments in the |
| Transformation (OUT) |
Show the transformation logic of the outgoing source code fragments in the |
| Lineage tree |
Show an alternative way to view the flow of data objects, called the lineage tree. The lineage tree is particularly useful if there are many nodes in a lineage. It enables you to see the entire lineage in one pop-up, which means you no longer have to scroll through the technical lineage graph to see the full lineage. The lineage tree uses arrows to visualize the traceability of data objects:
The lineage tree uses colors and arrows to visualize the traceability of data objects:
|
|
Custom features |
When the lineage flow of the table is incomplete or there is an issue in the source code of a data object, the right-click menu shows the Show failed SQLs option. If you click this option, the |
SELECT statements that result in "-RES" tables in the lineage
If you have SQL SELECT statements like the following, the results are not put into a table because they are not used in a DDL or DML query, such as INSERT or CREATE VIEW AS.
SELECT username, email
FROM dbo.users
In such cases, Collibra Data Lineage creates a dummy table, so that a complete lineage can be achieved. The dummy table has the name of the SQL file, and is appended with "-RES", as follows: "<filename>.SQL-RES".
To avoid the need for Collibra Data Lineage to create a dummy, you can add an INSERT or CREATE VIEW statement before your SELECT statement, for example:
CREATE VIEW user_info AS
SELECT username, email
FROM dbo.users
The resulting lineage is as follows:

