The data quality score is an aggregated percentage between 0 and 100 that summarizes the integrity of your data. A score of 100 indicates that Data Quality & Observability has not detected any quality issues, or that such issues are being suppressed. When a score meets the out-of-the-box or custom criteria to trigger a notification, Collibra sends a notification to the assigned recipients.
Understanding how Collibra calculates data quality scores helps you interpret the health of your data assets. This topic explains the logic that Collibra uses to calculate scores from Data Quality & Observability and external data quality tools.
Data Quality & Observability scoring calculation
Data Quality & Observability calculates scores based on the ratio of passing quality monitors to total active quality monitors. The engine uses the following formula:
(passing quality monitors / total active quality monitors) x 100
Where passing quality monitors are the number of data quality monitors associated with the asset that are currently in a "Passing" or "Learning" status. And the total active quality monitors are the number of quality monitors associated with the asset that are currently in an "Active" status.
When the system calculates this score, it applies the following rules:
- Suppressed rules: The calculation excludes suppressed rules from the total active count.
- Exceptions: Rules in exception status count as "breaking" (failing) in the score calculation.
- Consistency: This logic remains the same across all levels, including Data Quality Jobs, databases, and policies.
On the Quality tab, the application traverses the knowledge graph from the asset you are viewing down to the column level. It detects all relevant monitors from Data Quality & Observability for that column and returns the score.
Data Quality & Observability performs this calculation directly within Collibra.
Scoring classifications
Depending on the scoring threshold, which consists of predetermined scoring ranges, a data quality score falls into one of the following scoring classifications when Data Quality & Observability is the data quality source:
- Passing: A data quality score higher than or equal to the upper-most scoring threshold. The out-of-the-box passing range is 90-100. A passing score does not guarantee the absence of data quality issues. We recommend that you always review the results of jobs for any underlying issues.
- Warning: A data quality score between the passing and failing threshold. The out-of-the-box warning range is 76-89.
- Failing: A data quality score lower than or equal to the lower-most scoring threshold. The out-of-the-box failing range is 0-75. Failing scores clearly indicate potential data quality issues, making it essential to notify recipients so they can initiate an investigation and take further action.
Note Scoring classifications do not apply to data quality from external data quality tools.
The data quality scores in the following screenshot reflect the various out-of-the-box scoring classifications as they are shown in the run history chart on the Monitors tab of a job.
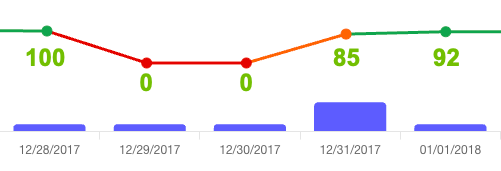
In the first segment, the score is 100. Because this is a passing score, no notifications are sent to assigned recipients, even when score-based notifications are enabled.
The second and third segments both show a failing score of 0. If score-based notifications are enabled, notifications are sent to assigned recipients. Failing scores clearly indicate potential data quality issues, making it essential to notify recipients so they can initiate an investigation and take further action.
The fourth segment shows a warning score of 85. Since the out-of-the-box score for sending notifications to assigned recipients is 75 or lower, no notification is sent. If you want to be notified of warning scores, consider aligning the score notification limit with the upper bound of the warning range in your scoring threshold.
In the fifth segment, the score of 92 falls within the passing score range. Similar to the first segment, no notifications are sent to assigned recipients; however, we still recommend that you review the job results for any potential issues.
Tip You can adjust the scoring thresholds to meet your organization's needs.
External data quality tool scoring calculation
For data provided by external data quality tools, Collibra calculates the score by averaging the passing fraction (or global score for Data Quality Jobs) attribute across all relevant assets.
The calculation follows these steps:
- The application traverses the knowledge graph from the asset you are viewing to the terminal asset type of the configured aggregation path.
- It identifies the passing fraction attribute for the terminal assets.
- It calculates the average of these values to return the final score.
The knowledge graph or data quality services perform this entire calculation.
How the score is calculated on asset pages
Collibra uses quality score aggregation paths to calculate the data quality score on asset pages. A quality score aggregation is a chain of relations from the target asset to the data quality source that instructs Collibra how to calculate data quality scores. Out-of-the-box aggregation paths are available for both Data Quality & Observability and external data quality tools. However, you may consider creating a custom aggregation path to link between data quality monitors and assets in Collibra.
The calculation method differs depending on whether the data originates from Data Quality & Observability or an external data quality tool.
Where data quality scores are shown
Data quality scores are shown in several locations throughout Collibra, including:
Monitoring Overview
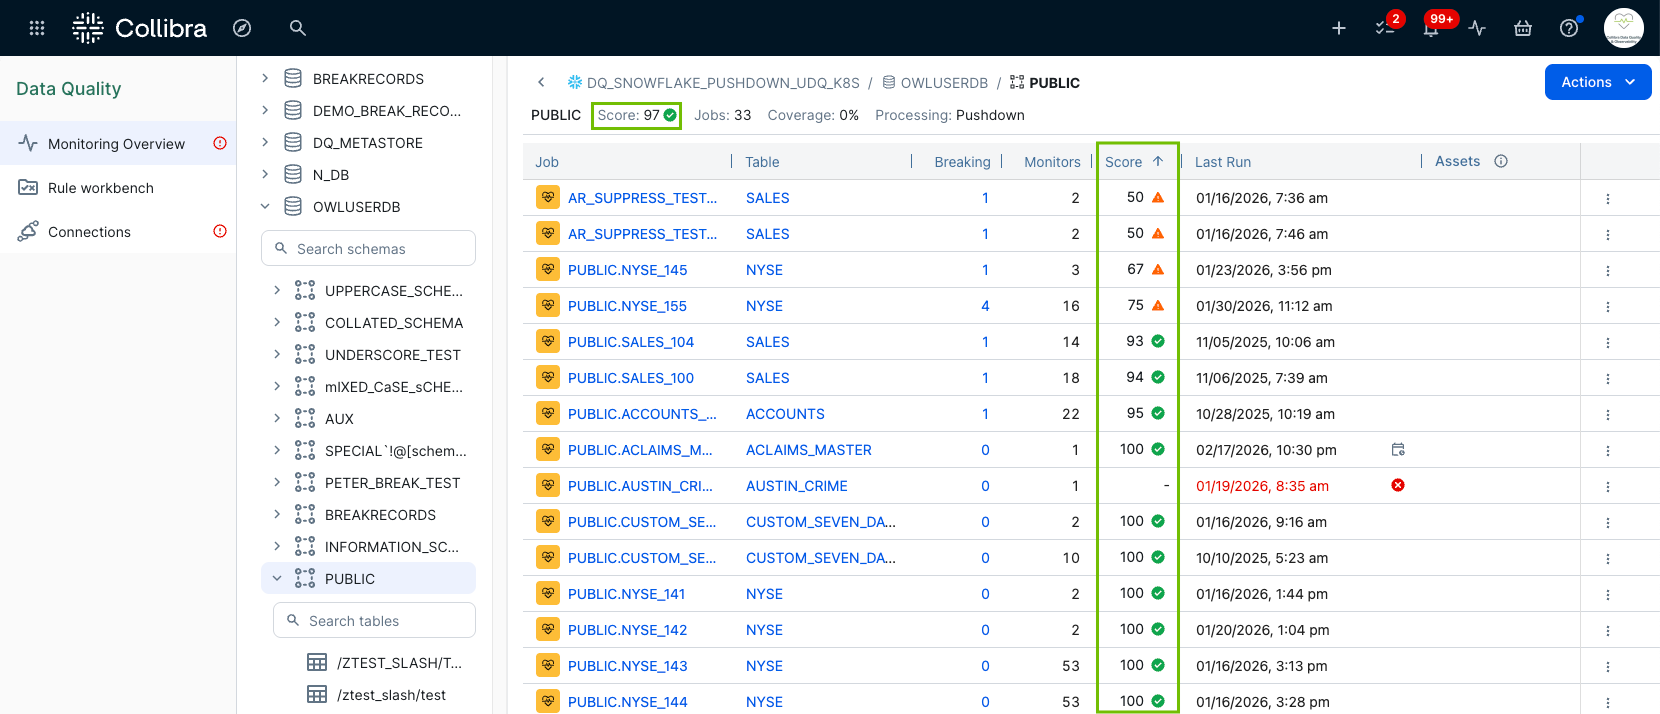
The Monitoring Overview page shows data quality scores in two locations:
- At the top of the page, next to the schema or table name. This score reflects the aggregated score roll up of all scores in the schema or table. This provides a simple indication of the health of the schema or table, allowing you to quickly determine whether you need to add more monitoring or investigate further.
- In the Score column of the overview table. The scores in this column reflect the score of the most recent run of each job.
Job Details page
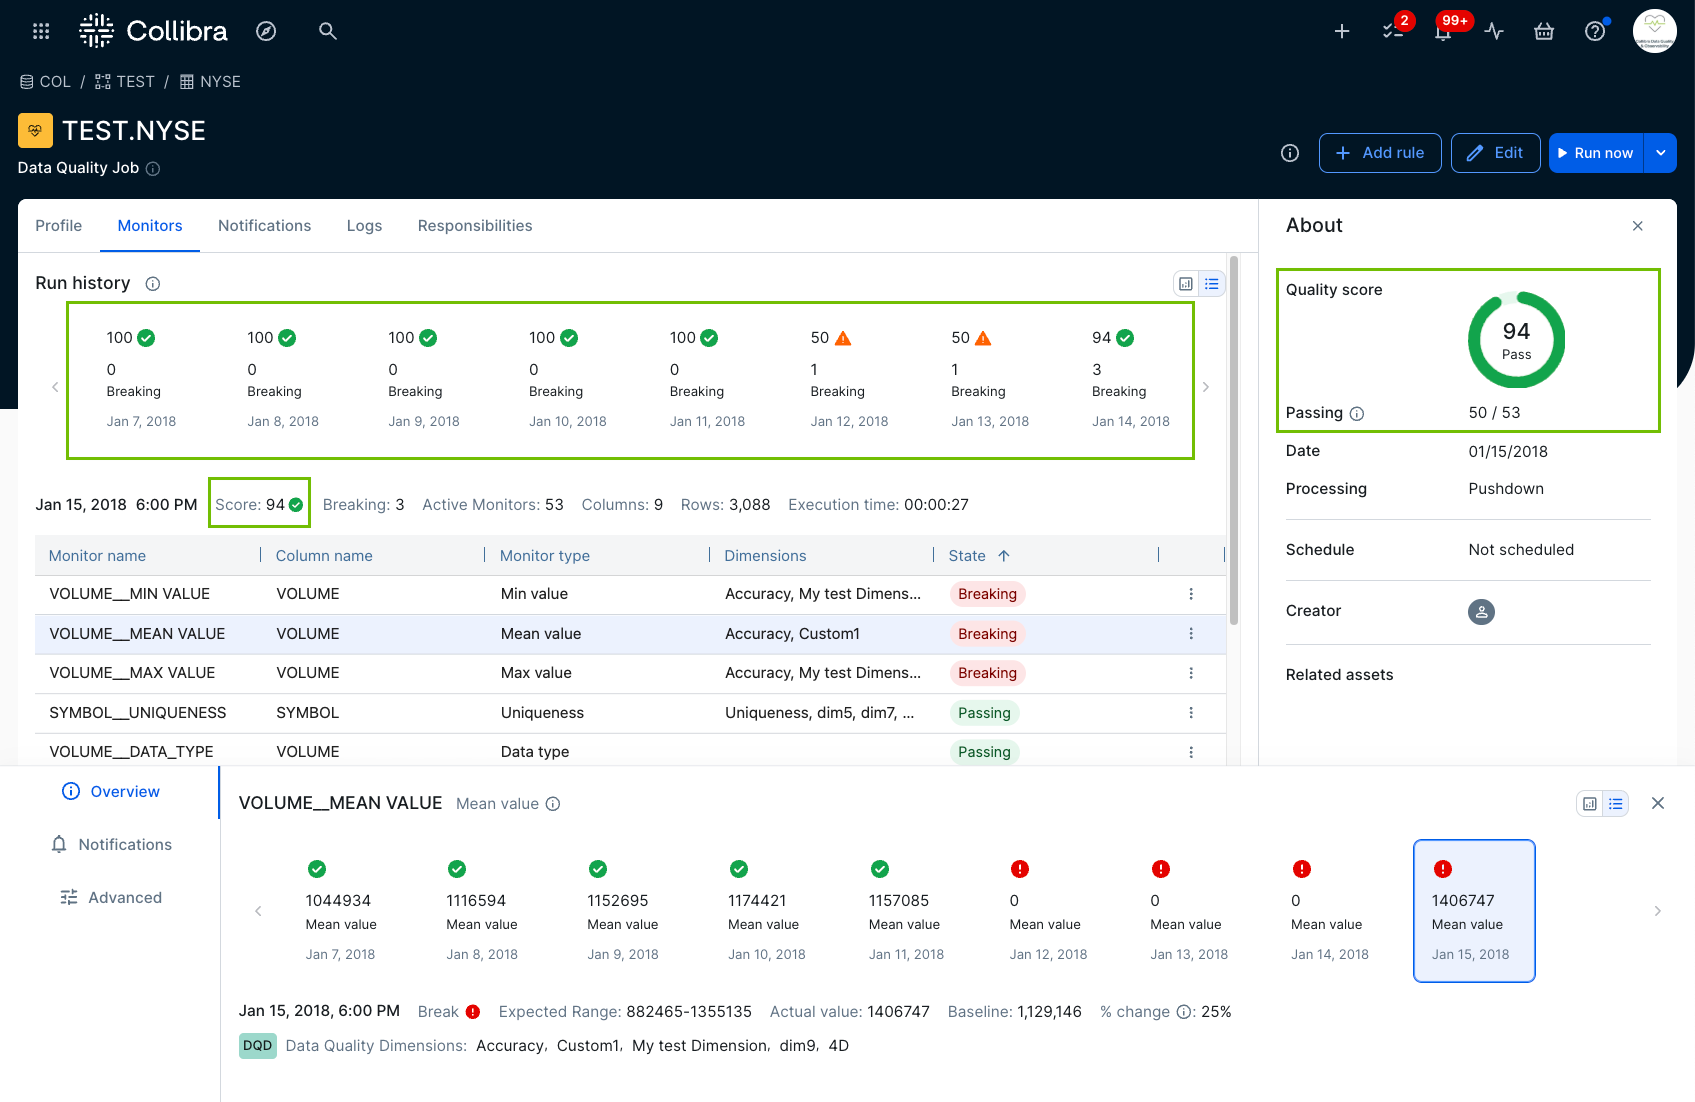
The Monitors tab of the Job Details page shows data quality scores in the following locations:
- The Run history chart shows the scores of previous runs.
- The About panel on the right side of the Job Details page shows the score of the latest job run. This score may change over time as the results of your job runs evolve.
- The run metadata section below the Run history chart shows the score of the selected run. When you select a different run from the chart, this score may change depending on the run you select.
Quality tab
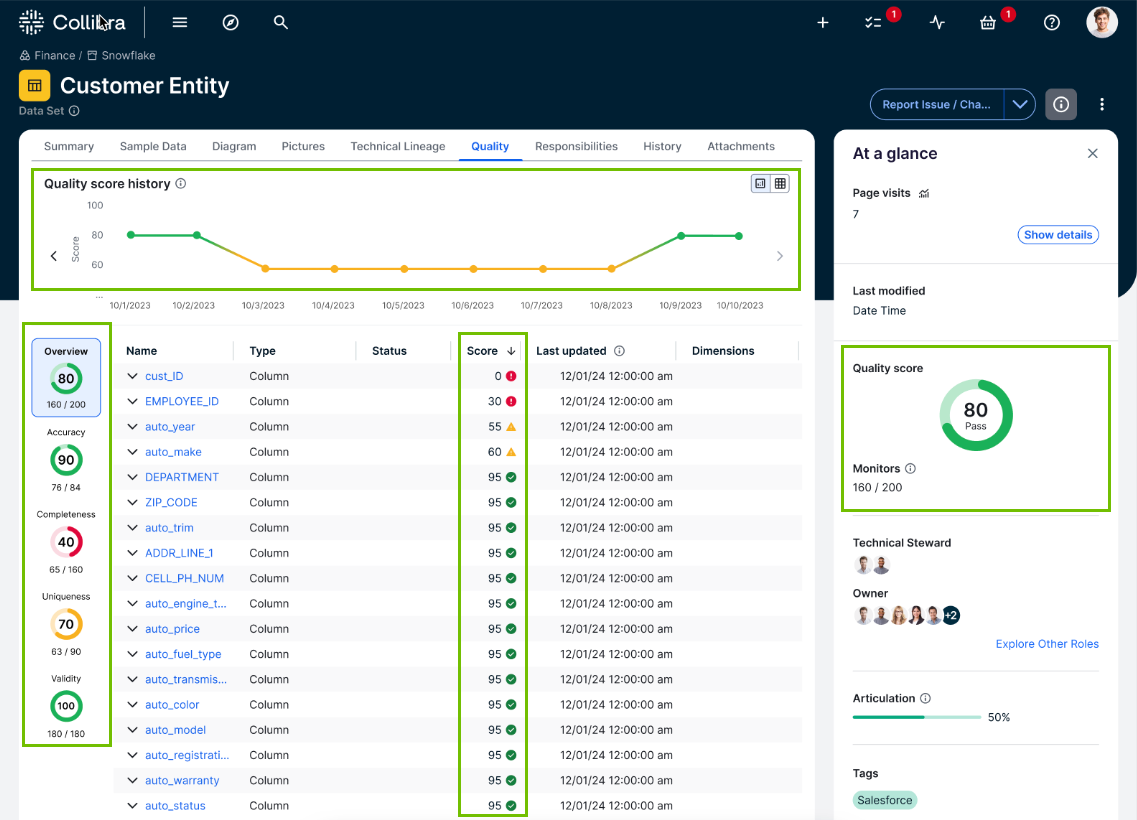
The Quality tab shows the overall data quality score, its history, and ring charts that depict the score of each data quality dimension. When an asset has associated data quality monitors from a data quality tool, you can view scoring details in the following areas of the Quality tab:
- For Data Quality & Observability: Collibra shows scores from Data Quality & Observability at the top of the Quality tab. If you configure Collibra to allow data quality information from both external data quality tools and Data Quality & Observability, you will see Collibra Data Quality and External Data Quality as two distinct sections.
- For external data quality tools: Collibra shows scores from external data quality tools on the Quality tab in the External Data Quality section, located below the Collibra Data Quality section.
Asset tables
The data quality score can be added to any asset table, list view, or diagram. This applies to columns, tables, database views, business rules, data product input and output ports, and data products. To enable this option:
-
Follow the steps to Assign or unassign a characteristic type.
-
Add the Data Quality Score, Passing Quality Monitors, and Total Active Quality Monitors attributes to the Overview page.
-
Publish the changes.
-
On an asset page, click Edit fields to add the "Data Quality Score" field to a table or tile.
Search
When you search for a Data Quality Job, its aggregated score is shown below its name.
