About the Monitoring Overview page
- Explore the hierarchy of your data sources, schemas, and tables.
- Add quick monitoring to your schemas.
- Initiate the Data Quality Job process on tables.
- View key high-level details about jobs that previously ran.
Overview of the Monitoring Overview page user interface
The following image and sections describe the key functional areas of the Monitoring Overview page.
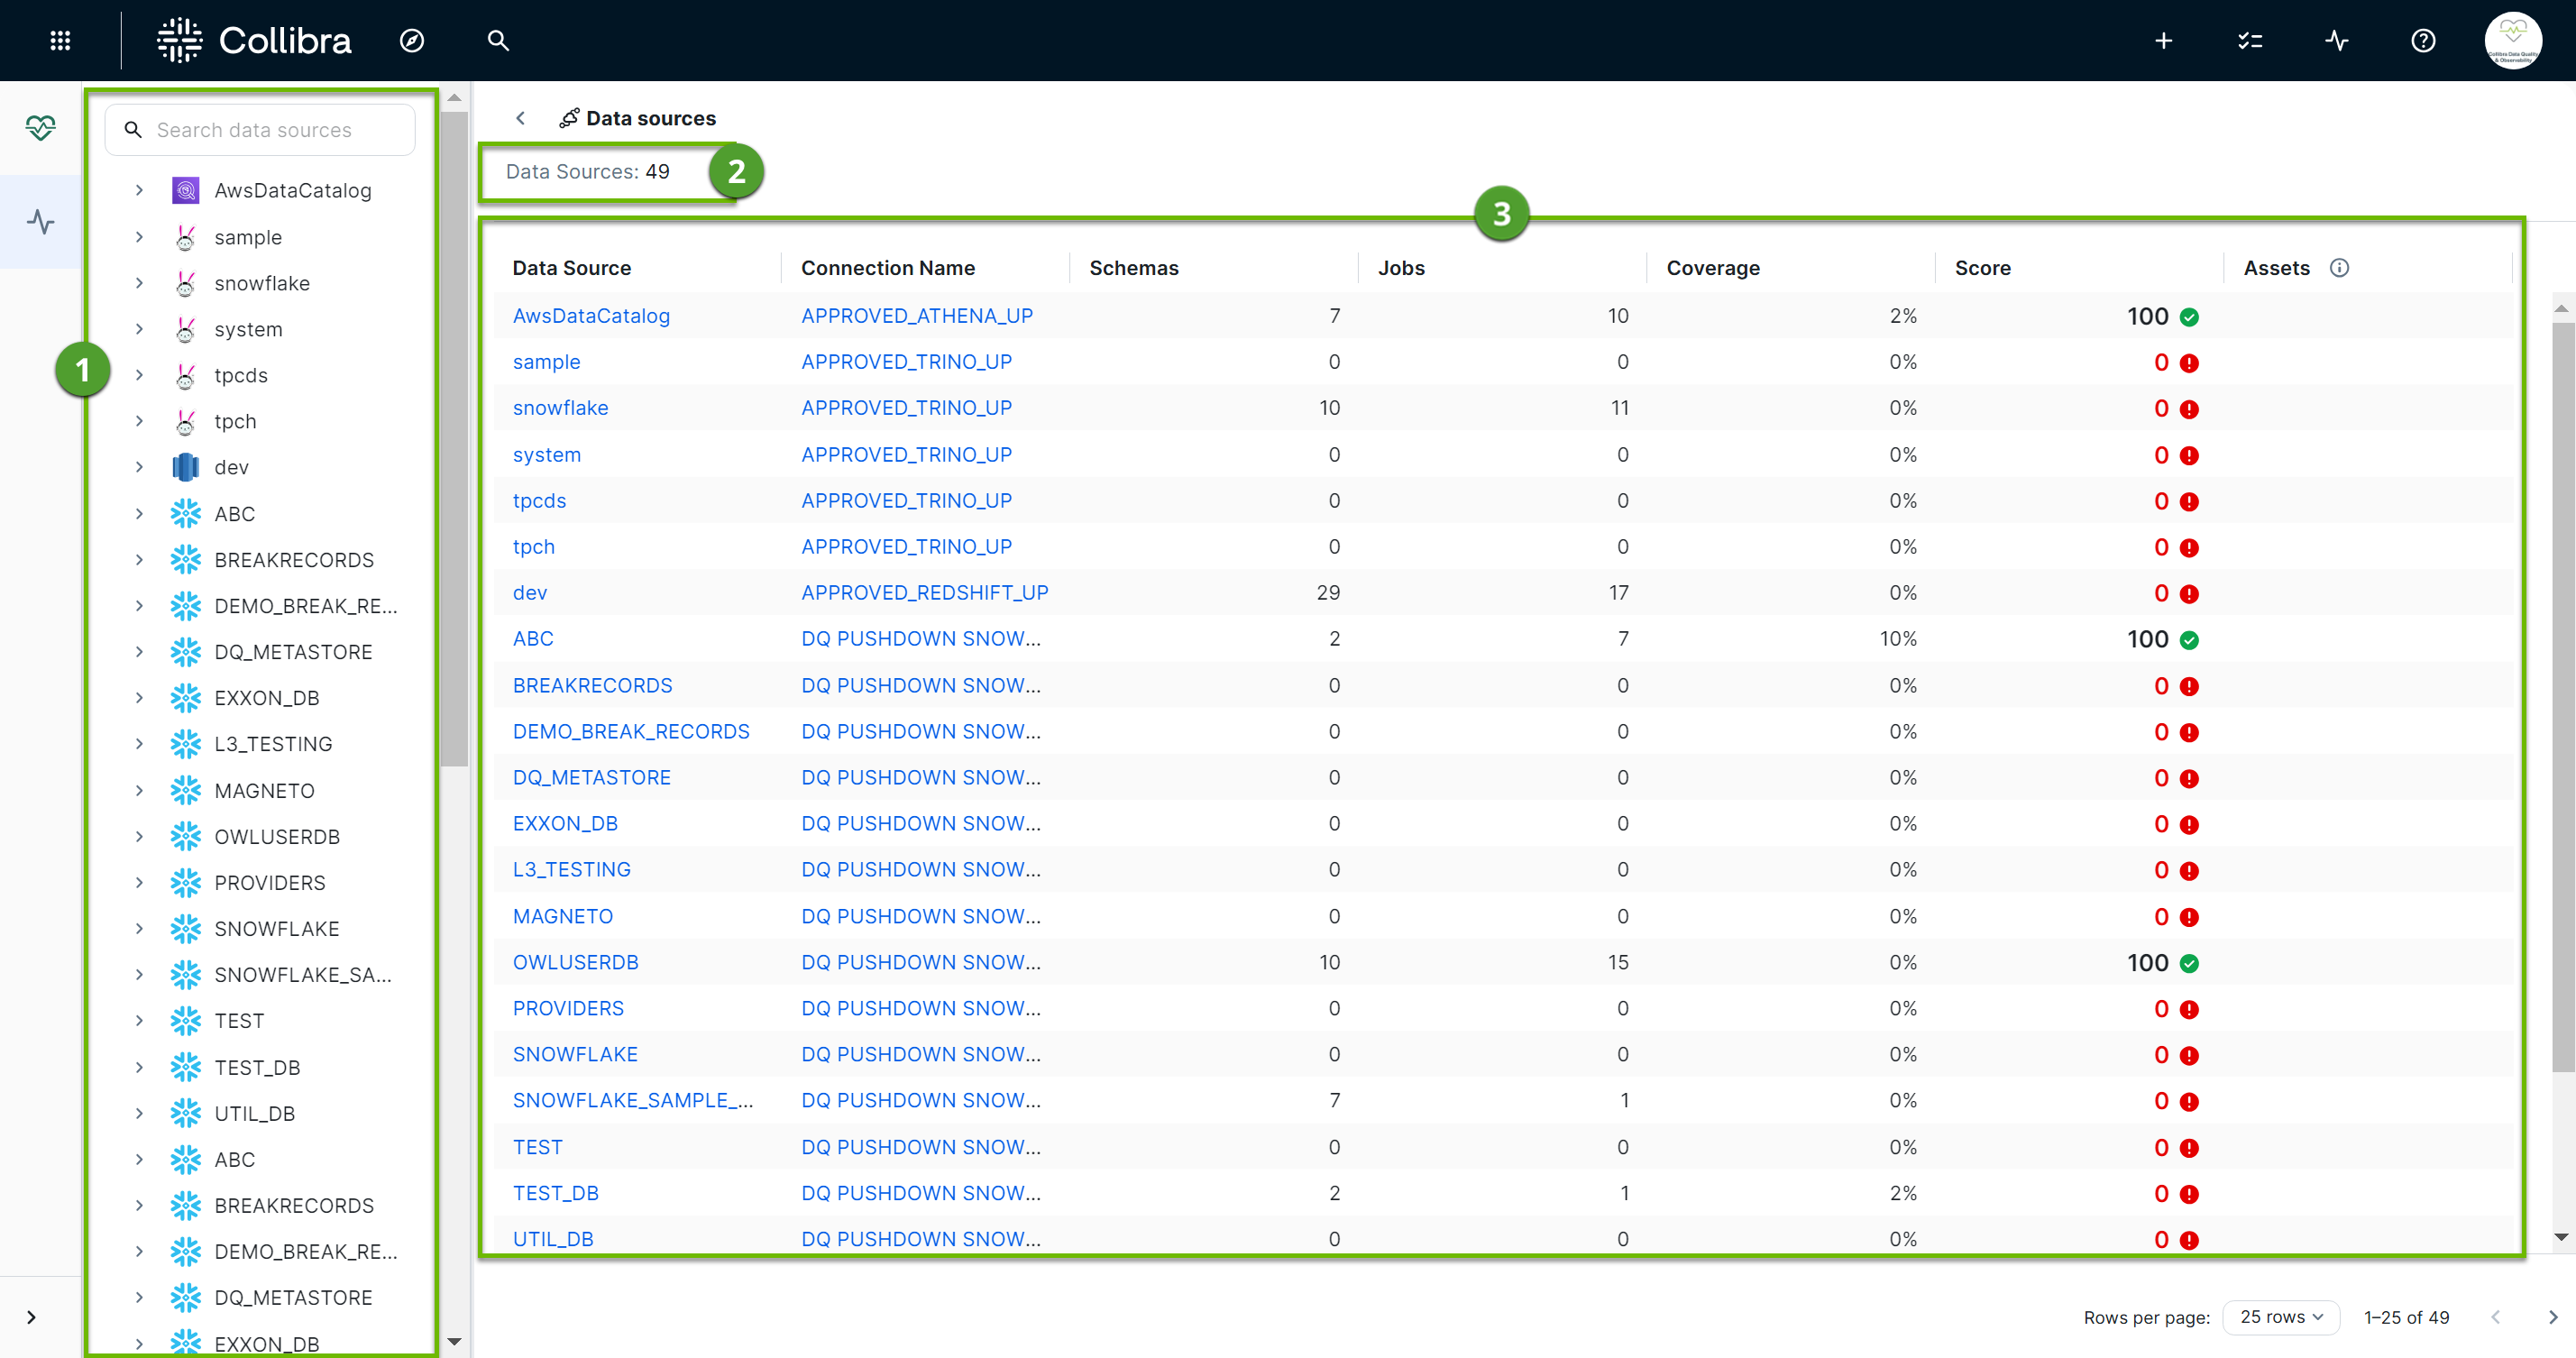
Data explorer
The data explorer ( ) provides an expandable, searchable data source hierarchy that allows you to view and select available data sources, schemas, and tables. This includes all Edge connections with the Data Quality Pullup Processing or Data Quality Pushdown Processing capability enabled.
Note If your data source is not available in the data explorer, go to your Edge site to Create a JDBC connection.
Data source metadata
The data source metadata section ( ) allows you to see the number of available data sources you can monitor for data quality in Collibra. The name of your connected data source includes a hyperlink that routes you directly to the Connections page.
Data source overview table
The data source overview table ( ) provides the high-level details of your selected data source, including:
- Data source
- Connection name
- Number of schemas
- Number of jobs
- The aggregate data quality score
- Related Assets
- Explore your data sources and schemas.
- Add quick monitoring.