Explore data sources and schemas
Prerequisites
- The Data Quality Pushdown Processing or Data Quality Pullup Processing Edge capability is enabled for your data source.
- You have one of the following permissions:
- A global role with the Product Rights > Data Quality global permission.
- A resource role with the Data Quality Connection > View resource permission.
Steps
- Open Data Quality & Observability.
-
On the main toolbar, click
 →
Data Quality.
→
Data Quality.
Monitoring Overview opens. - Click a data source in the data explorer. The schema overview table is shown to the right of the data explorer.
- You can either click
 to expand the available schemas within the data source or review the schema details to the right of the data explorer. When you click
Schema overview table
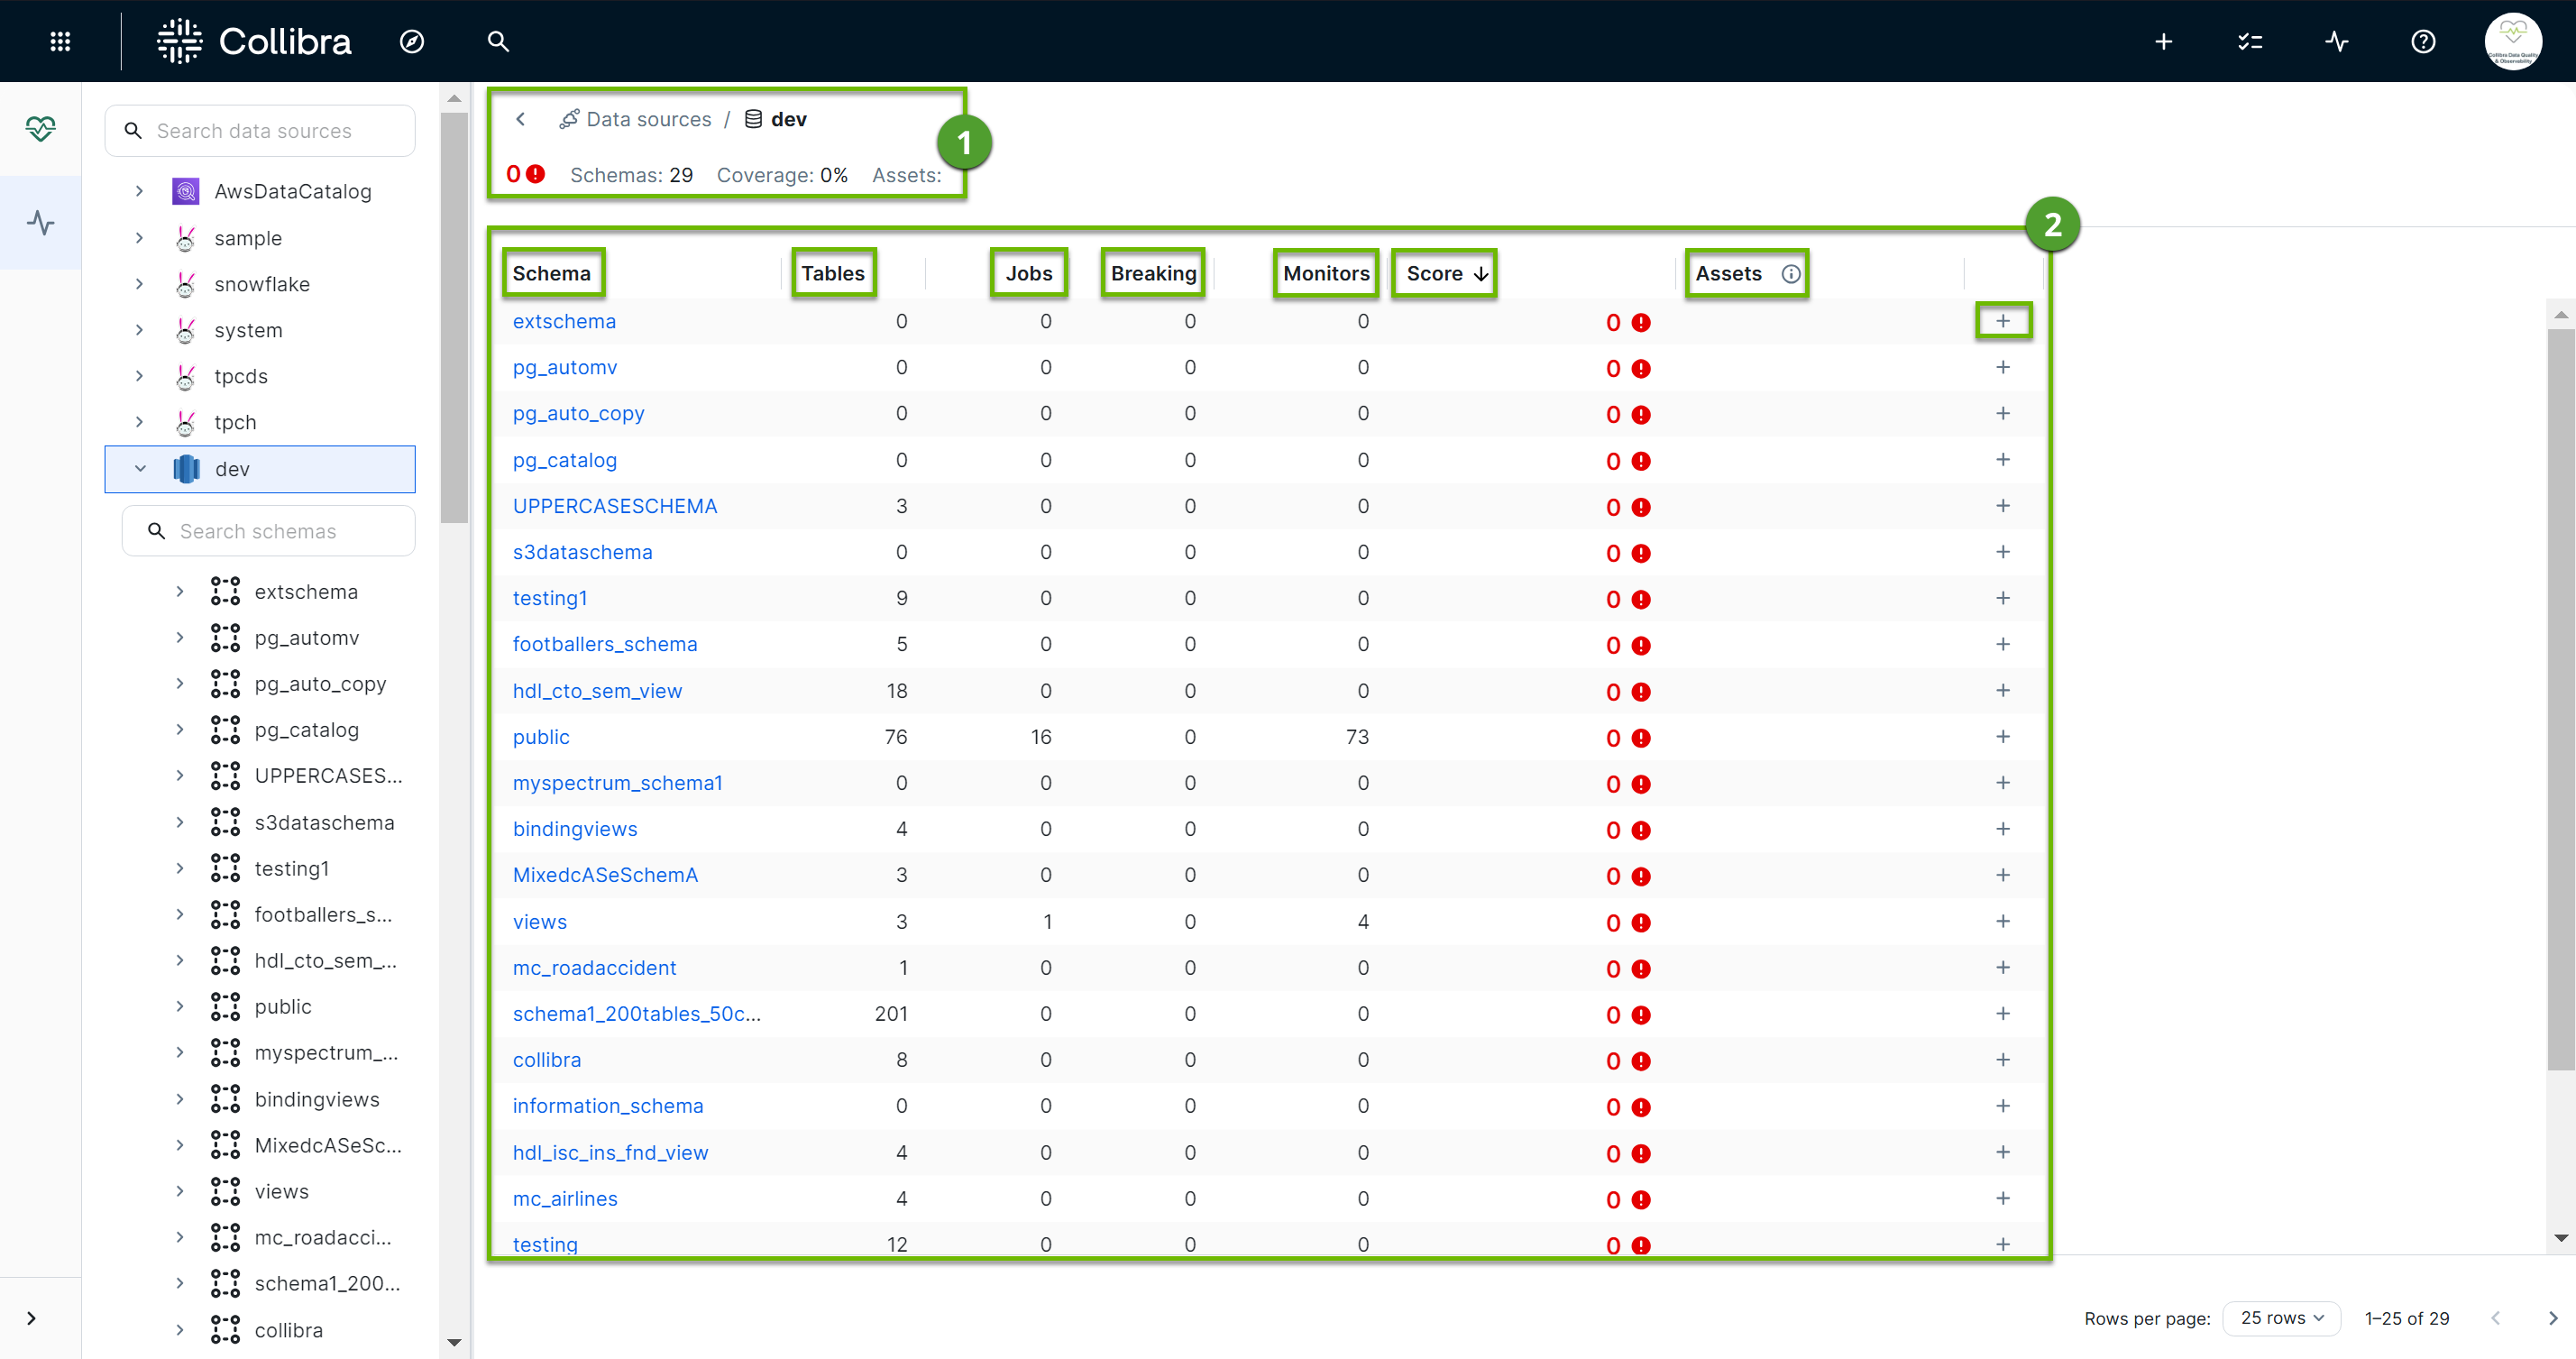
| Element number | Element name | Description |
|---|---|---|
 | Data source metadata and breadcrumbs | The data source metadata shows:
The breadcrumbs above the data source metadata allow you to view the source of your data and quickly navigate to the data source. |
 | Schema overview table | High-level monitoring details about your schema. Each column contains a different data point that contributes to how completely your data is monitored, and allows you to take action, such as add quick monitoring, accordingly. The available columns include:
|
- Open Data Quality & Observability.
-
On the main toolbar, click
→
Data Quality.
Monitoring Overview opens. - Click a data source in the data explorer. The schema overview table appears to the right of the data explorer.
- You can either click to expand the available schemas within the data source or review the schema details to the right of the data explorer. When you click
- Click to expand the available tables within the schema or click the name of a table from the schema details table to the right of the data explorer. The job overview table appears to the right of the data explorer.
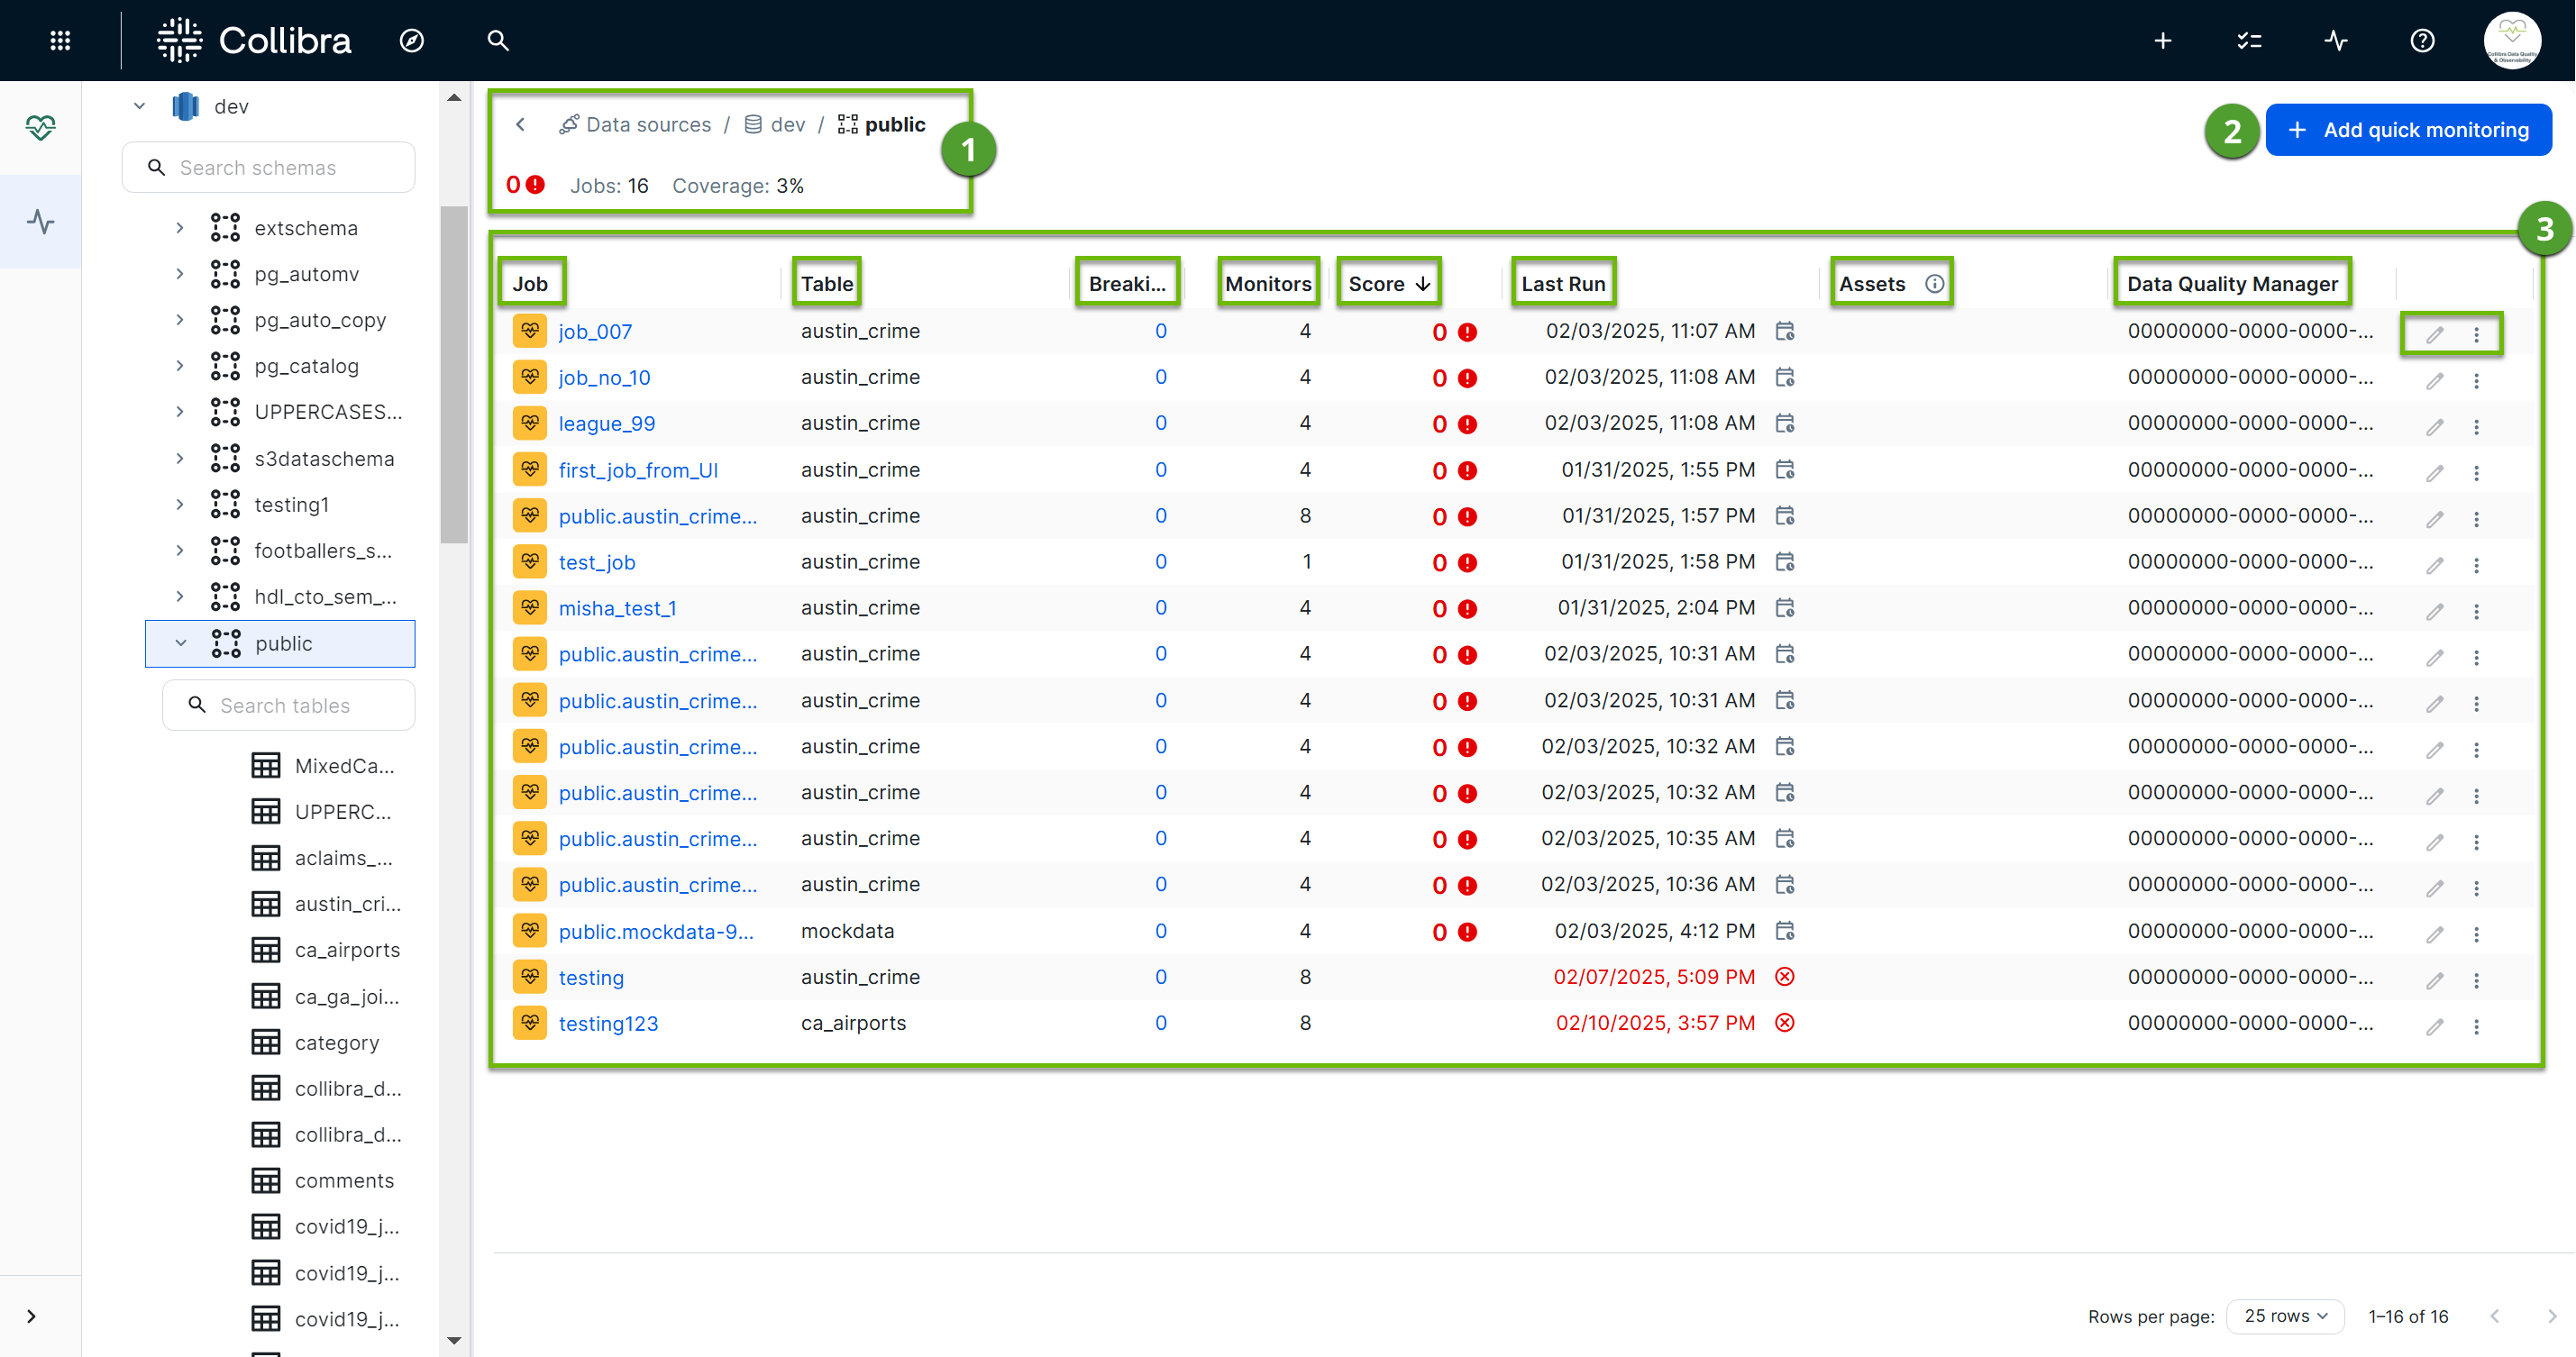
Job overview table
The job overview table, located to the right of the data explorer, shows key high-level details about the health of the data in the tables of your schema. This overview provides a quick understanding of jobs that have run or are scheduled to run, who is assigned to each job, and allows you to take further action.
| Element number | Element name | Description |
|---|---|---|
| Data source metadata and breadcrumbs | The data source metadata shows the number of Data Quality Jobs that have run on tables in your schema. The breadcrumbs above the data source metadata allow you to view the source of your data and quickly navigate to the data source or schema. |
| Actions | The actions button opens a drop-down list with the following options:
|
 | Job overview table | High-level monitoring details about your schema. Each column contains a different data point that contributes to how completely your data is monitored, and allows you to take action, such as add quick monitoring, accordingly. The available columns include:
Click |
- If you haven't done so already, Add quick monitoring to deploy monitoring via basic Data Quality Jobs to your schemas.
- About Data Quality Jobs at the table-level.