About monitoring coverage

Monitoring coverage is the percentage of the number of active jobs divided by the number of tables. A data source or schema with low coverage might indicate insufficient data quality monitoring, making the coverage percentage a useful tool for helping determine whether additional monitoring is needed.

After you deploy monitoring, the coverage percentages are updated on the data sources overview, data source, and schema sections of the Monitoring Overview page.

Tip The quickest way to improve monitoring coverage is to add quick monitoring at the schema level.

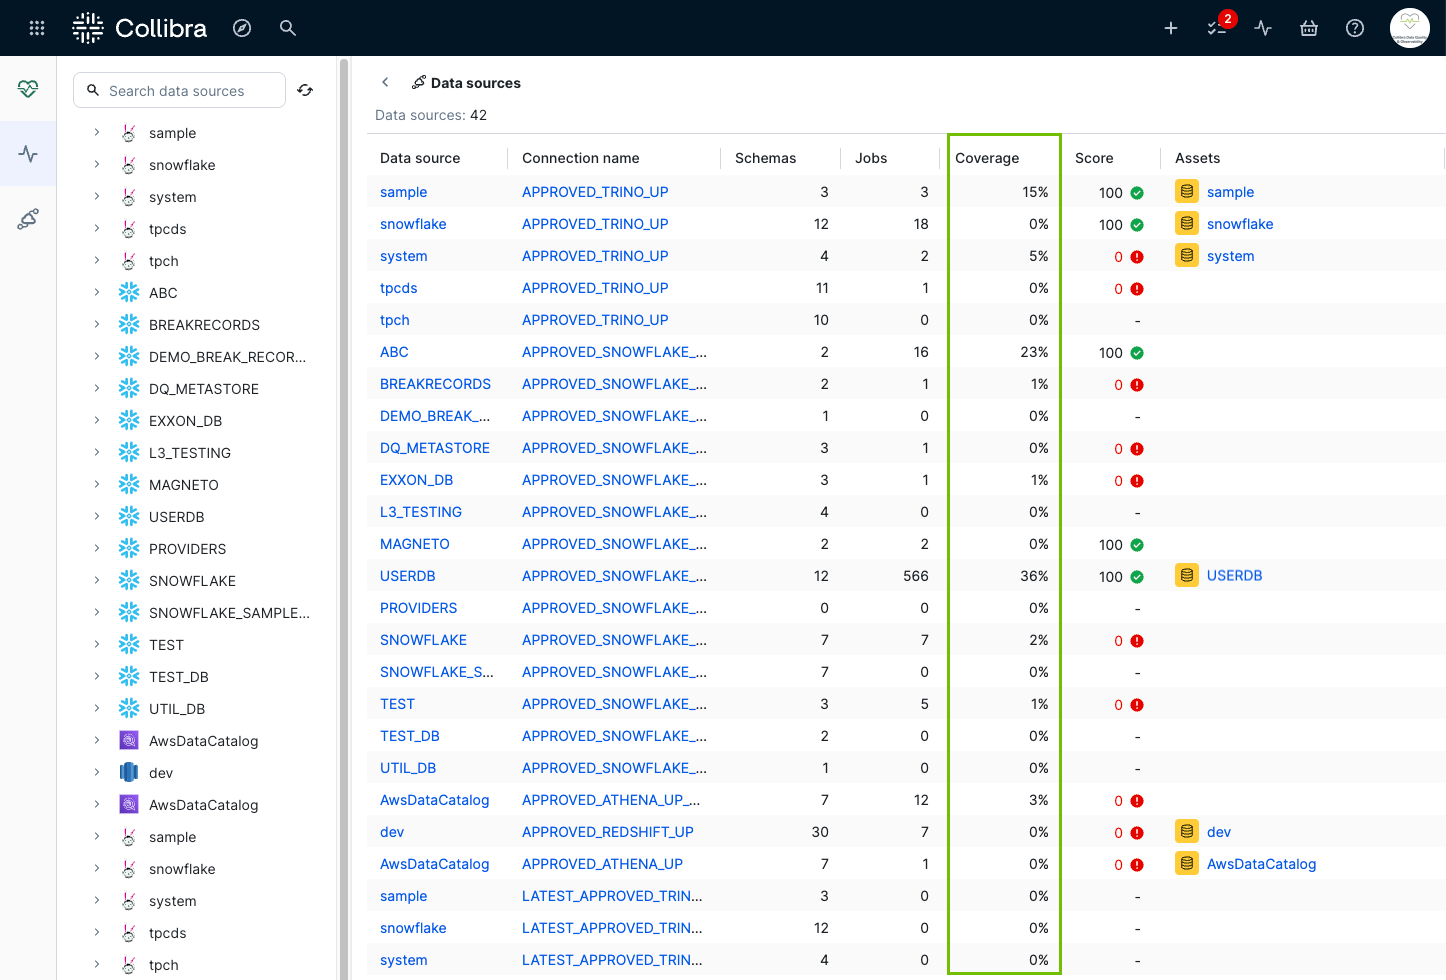
When you open the Monitoring Overview page, a summary of the data quality coverage of your data sources is shown. This provides insight into which data sources might require additional Data Quality Jobs to increase coverage, either through quick monitoring or individual table-level jobs.

Example The following example shows the monitoring coverage across 42 data sources in a Data Quality & Observability environment. While several data sources have some degree of coverage, many have no coverage. For data sources without coverage, you can add quick monitoring to establish monitoring coverage of schemas.

screenshot of the monitoring coverage of data sources

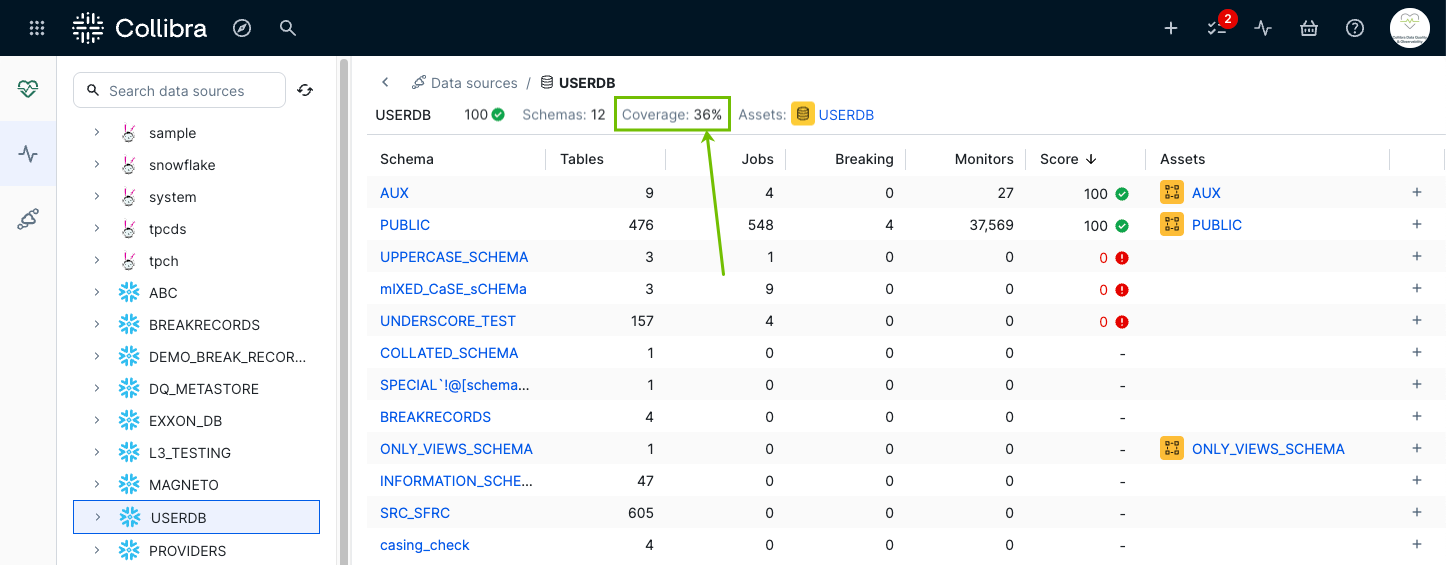
When you open a data source on the Monitoring Overview page, a summary of the monitoring coverage of its schemas is shown. In addition to the coverage percentage, the table below the data source metadata shows which schemas have jobs, active monitors, and breaking monitors. These insights help you determine which schemas need additional monitoring coverage.

Example The following example shows the monitoring coverage across 12 schemas in the USERDB Snowflake data source. While 5 schemas have jobs that have run against their tables, 7 do not. For schemas without monitoring, you can click Plus icon to add quick monitoring to the schema. You might also consider adding additional monitoring to schemas with more tables than jobs, such as AUX, as this imbalance might indicate inadequate coverage.

screenshot of monitoring coverage at the schema-level

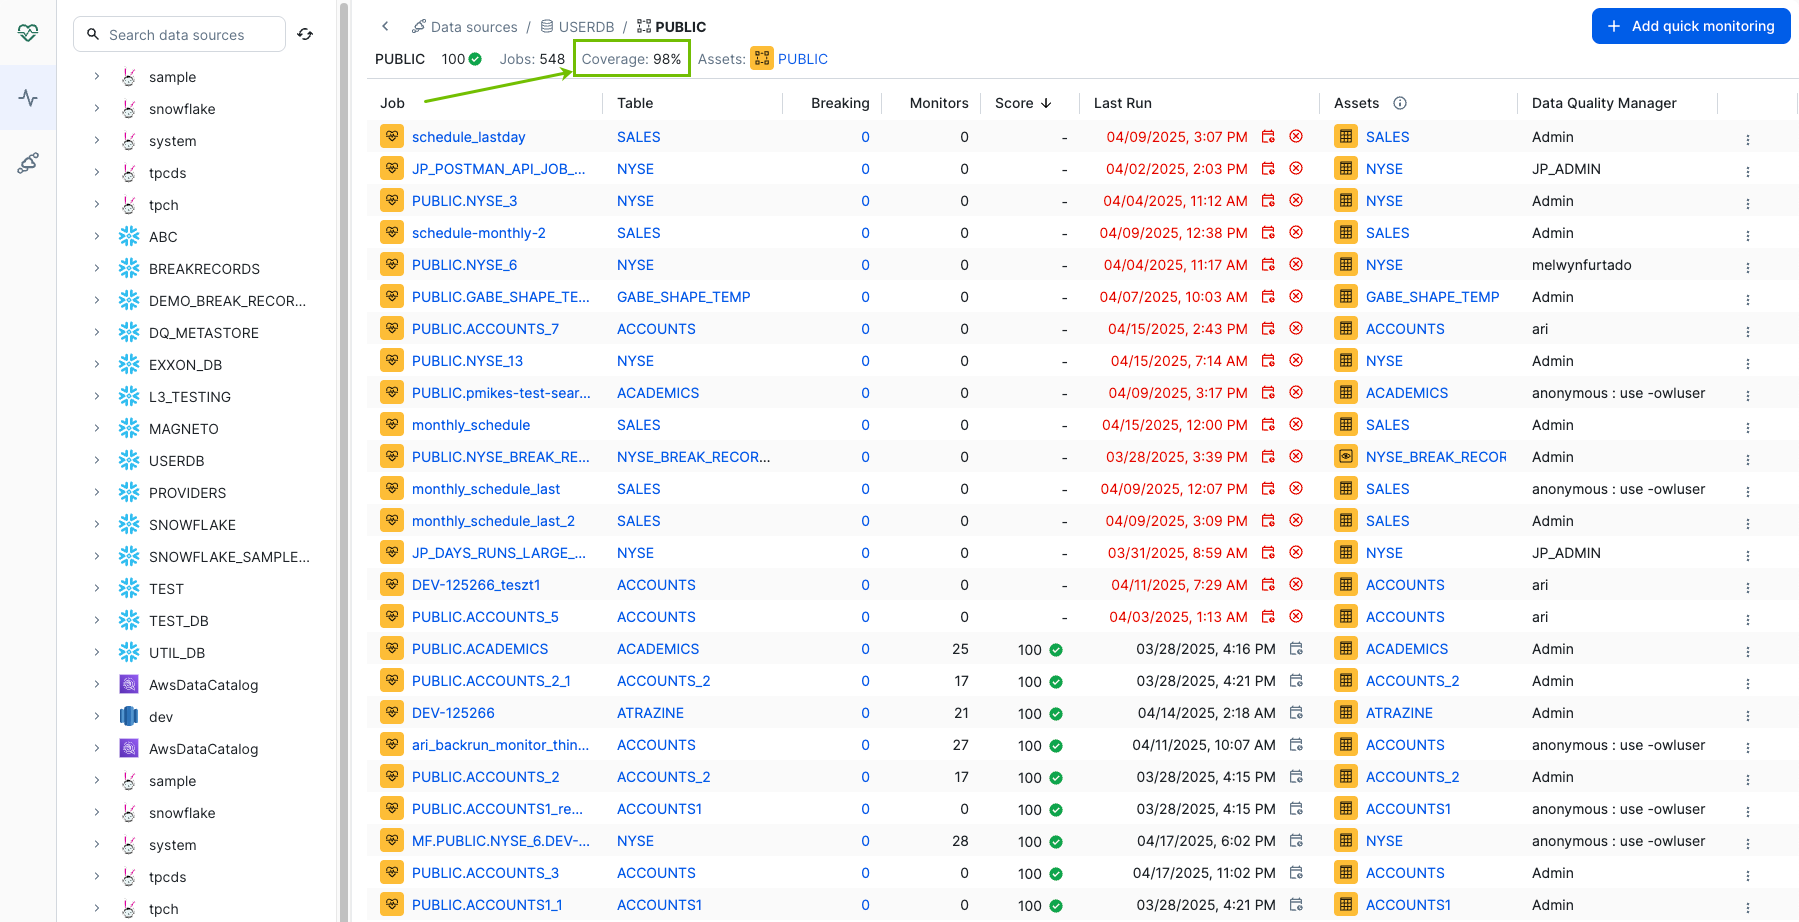
When you open a schema on the Monitoring Overview page, a summary of its monitoring coverage and details about its active jobs are shown. This helps you determine whether the most important tables in your schema have adequate monitoring or if you need to add additional monitoring to increase coverage.

Example The following example shows that the PUBLIC schema of the USERDB Snowflake data source has a 98% coverage. This level of coverage might be adequate, as 548 jobs have run against the various tables of the PUBLIC schema. However, you can click Plus icon Add quick monitoring to ensure all tables have coverage.

screenshot of monitoring coverage at the table-level

What's next?