After setting up Insights Data Access on Databricks Lakebase, you can generate dashboard reports configured in Collibra Console or via a shareable URL.
Prerequisites
- Set up Insights Data Access on Databricks Lakebase.
- Ensure that you have the following:
- The Insights global role, to be able to view a report in Collibra Platform.
- A license for Tableau Desktop 2018.3.
- A Tableau Server or Tableau Online account.
Steps
- Download the report templates from Collibra Marketplace.
- Install the SQL views and configure Lakebase permissions and indexes.
- Publish the workbook files to your Tableau Server or Online account and configure a refresh schedule event.
- Configure the reporting options in Collibra Settings.
- Add a dashboard in Collibra and configure the Insights widget.
Step 1: Download the report templates from Collibra Marketplace
- Go to Collibra Marketplace.
- Download the following three report template packages:
- Process Register Report Template
- Privacy and Risk Readiness Report Template
- Data Maturity Report Template
- Extract the ZIP files on your local computer.
Folders with the names of the ZIP files are created. Each folder contains a SQL file and a TWBX file.
Step 2: Install the SQL views and configure Lakebase permissions and indexes
- If this is the first time you are installing the SQL views, you must perform this step for each of the Tableau workbook files.
-
If you have previously installed the SQL views but are now installing a new version of a report, you must install the new SQL view, if one was provided with the new report.
- On the Lakebase left menu, select SQL Editor.
- Copy the SQL file from one of the report template packages into the SQL editor.
- Click Run query.
- Repeat Steps 2 and 3 for the SQL files in the other two report template packages.
A materialized view is created for each of the three queries. - Once the three materialized views are created, run the following SQL to grant `SELECT` (views don't grant it by default):Copy
-- 1. Enable traversal through the data catalog and schema
GRANT USE CATALOG ON CATALOG your_catalog TO `your_principal`;
GRANT USE SCHEMA ON SCHEMA your_catalog.your_schema TO `your_principal`;

-- 2. Grant the explicit capability to execute the refresh command
GRANT REFRESH ON MATERIALIZED VIEW your_catalog.your_schema.your_mv TO `your_principal`;

For 3 materialised views and loader
GRANT SELECT ON insights.data_maturity TO collibra_loader;
GRANT SELECT ON insights.process_register TO collibra_loader;
GRANT SELECT ON privacy_risk_readiness TO collibra_loader; - Once permissions are granted, create the following indexes for the three materialized views:Copy
--Data Maturity
--1. The Grouping & Dimensional Columns
CREATE INDEX idx_community_name ON insights.data_maturity ("[Community] Level Community Name");
CREATE INDEX idx_asset_type ON insights.data_maturity ("[Asset] Asset Type Name");

-- Composite index for your matrix views
CREATE INDEX idx_community_asset_matrix ON insights.data_maturity ("[Community] Level Community Name", "[Asset] Asset Type Name");


--2. The Conditional Logic & Filter Columns
CREATE INDEX idx_asset_status ON insights.data_maturity ("[Asset] Status Name");
CREATE INDEX idx_role_name ON insights.data_maturity ("Role Name");

--3. The Aggregation Target
CREATE INDEX idx_asset_id_countd ON insights.data_maturity ("[Asset] Asset Id");

--4. The Snapshot Date (Top 1 Filter)
CREATE INDEX idx_snapshot_date ON insights.data_maturity ("[Asset] Snapshot Date");


-- Process Register

1. The Quick Filters

-- Indexes for Interactive Dashboard Filters
CREATE INDEX idx_pr_domain_name ON insights.process_register ("[Asset - Domain] Domain Name");
CREATE INDEX idx_pr_status_name ON insights.process_register ("[Asset - Business Process] Status Name");
CREATE INDEX idx_pr_controller ON insights.process_register ("Controller filter");
CREATE INDEX idx_pr_processor ON insights.process_register ("Processor filter");
CREATE INDEX idx_pr_section_name ON insights.process_register ("section_name");
CREATE INDEX idx_pr_attribute_type ON insights.process_register ("attribute_type_name");

2. The Snapshot Date (Top 1 Subquery)

-- Index to instantly resolve the MAX() date subquery
CREATE INDEX idx_pr_snapshot_date ON insights.process_register ("[Asset - Business Process] Snapshot Date");

3. The Custom Sorting Column

-- Index for Tableau's computed sort
CREATE INDEX idx_pr_section_order ON insights.process_register ("section_order");

4. The Table Hierarchy (Row Grouping)

-- Indexes for Row-level grouping
CREATE INDEX idx_pr_bp_name ON insights.process_register ("[Asset - Business Process] Asset Full Name");
CREATE INDEX idx_pr_party_name ON insights.process_register ("asset_full_name1");

-- Privacy Risk Readiness

1. The Text Hierarchies (Row Groupings)

-- Indexes for Worksheet Row Groupings
CREATE INDEX idx_priv_bp_name ON insights.privacy_risk_readiness ("[Asset - Business Process] Asset Full Name");
CREATE INDEX idx_priv_ds_name ON insights.privacy_risk_readiness ("[DataSet - Name]");
CREATE INDEX idx_priv_tp_name ON insights.privacy_risk_readiness ("[Third Party - Name]");

2. The Completeness Aggregations (COUNTD)
-- Indexes to speed up Distinct Counts (KPI calculations)
CREATE INDEX idx_priv_purpose_id ON insights.privacy_risk_readiness ("[Asset - Purpose] Asset Id");
CREATE INDEX idx_priv_controller_id ON insights.privacy_risk_readiness ("[Asset - Party:Controller] Asset Id");
CREATE INDEX idx_priv_processor_id ON insights.privacy_risk_readiness ("[Asset - Party:Processor] Asset Id");
CREATE INDEX idx_priv_owner_user ON insights.privacy_risk_readiness ("[Responsibility - Owner] Username");
CREATE INDEX idx_priv_dsa_name ON insights.privacy_risk_readiness ("[Third Party - DSA]");
Step 3: Publish the workbook files to your Tableau Server or Online account and configure a refresh schedule event
- On your hard drive, go to the folder of one of the report templates you downloaded from Collibra Marketplace (for example, DataMaturity).
- Open the Tableau Workbook file (in this example, DataMaturityDashboard_Lakebase.twbx).
- If the following dialog box appears, click Yes.
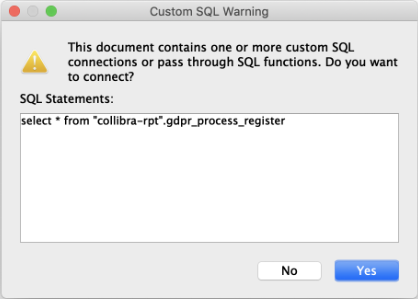
- Perform one of the following steps:
- If a dialog box appears, click Edit connection.
- If the Tableau dashboard is shown, click the Data Source tab in the lower-left corner of the page.
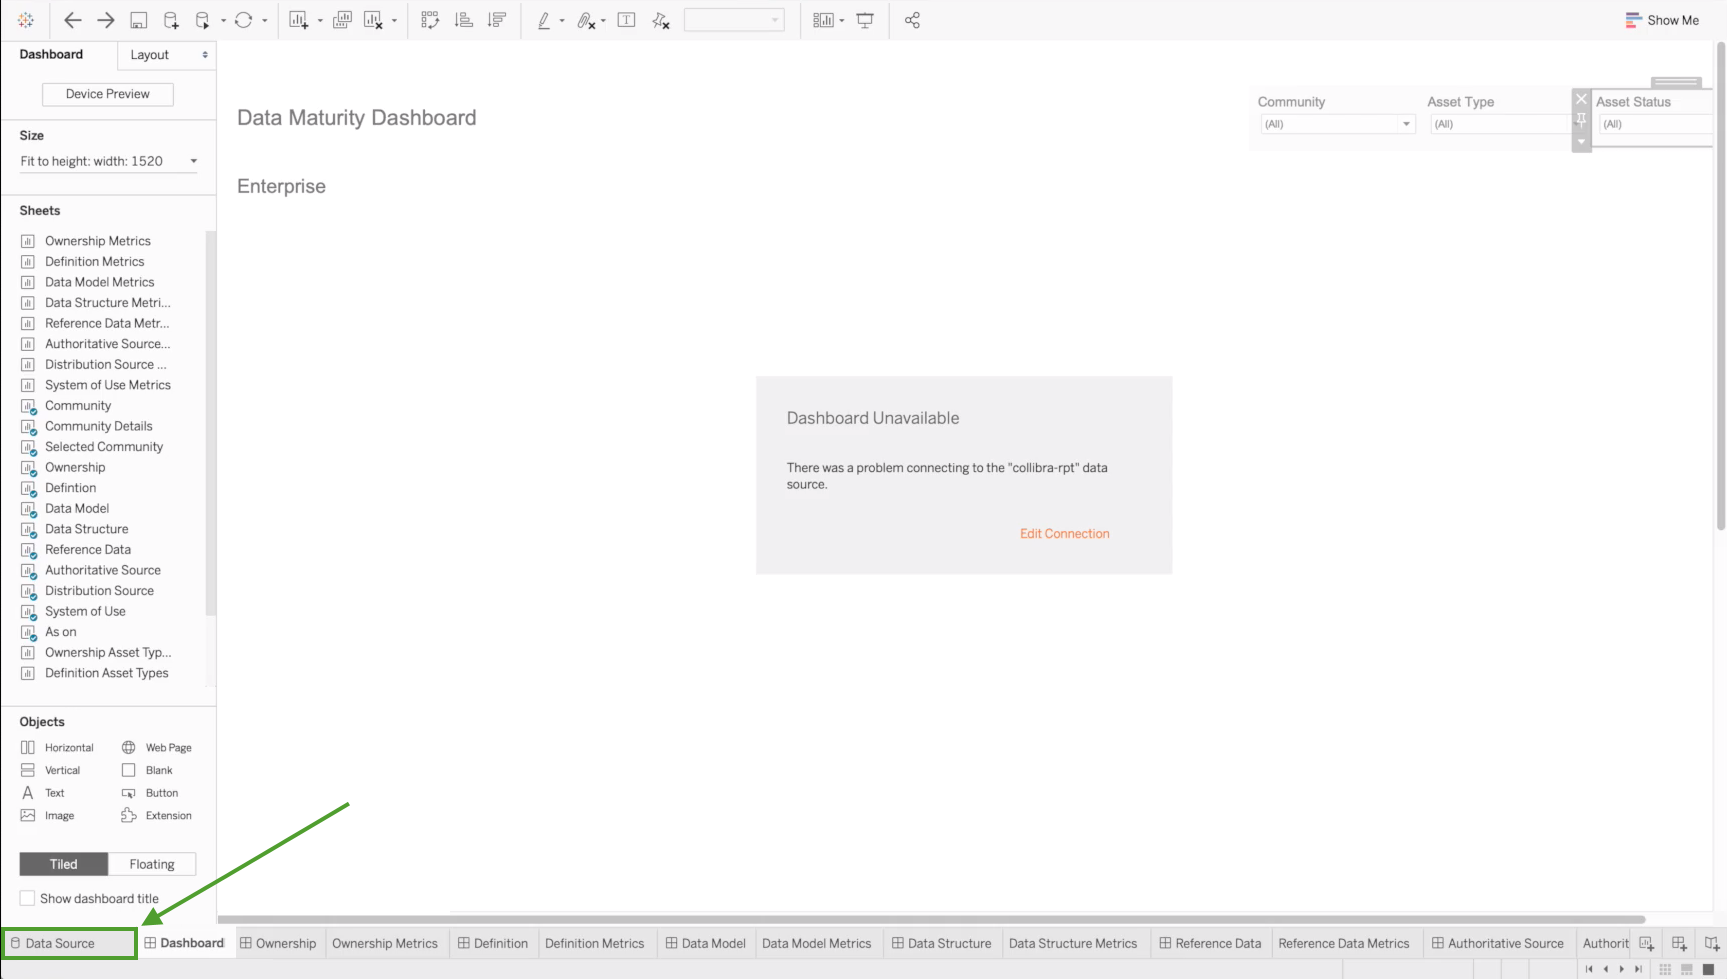
- If a dialog box appears, click Edit connection.
- Enter the information specific to your Databricks Lakebase (host, port, database, user, password).
Note Selecting Require SSL is mandatory and the Password field is mandatory, even though it may appear optional in the dialog.
- Click Sign in.Note If you now receive an error, it may be an indication that the data source "collibra_rpt" is not configured. In this case, consider editing the connection details to point to the data source you have created.
- In the upper-right corner of the page, select an Extract connection.

- In the lower-left corner of the page, click the Dashboard tab.
- In the Save As dialog box, enter a name for the database extract file.
- Click Save.
The extract file is saved and a database extract is cached. This can take several minutes to complete. - When the dashboard is loaded, click
 or File > Save to save the database extract.
 - On the main menu, click Server, and then click Sign In.
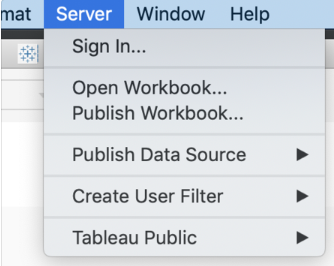
- In the Tableau Server Sign in dialog box, click Connect.
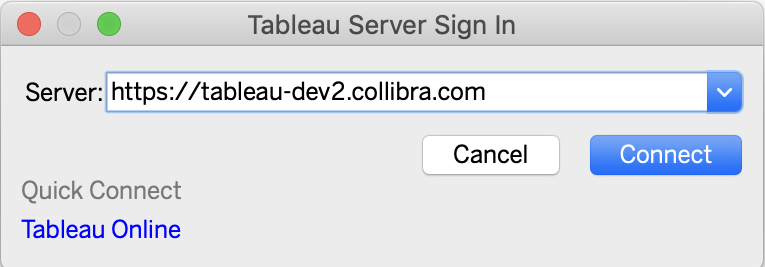
- Enter your Tableau sign in credentials.
- Select the site to which you want to publish the Tableau workbook.
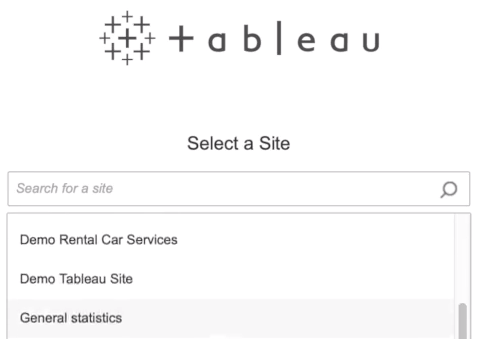
- Click Server, and then select Publish Workbook.
The following dialog box appears.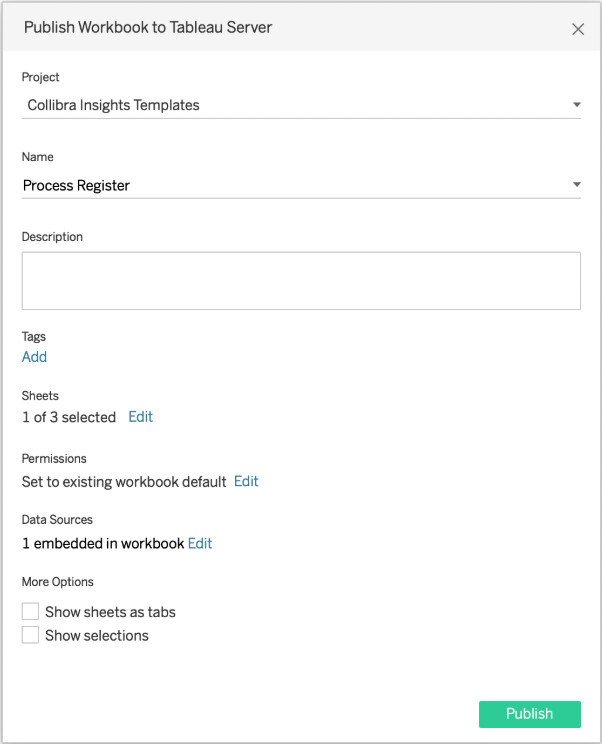
- Enter the required information.
For the current task, the following fields are of interest.Property Description Project The project to which you want to publish. Name The name of the workbook.
Refresh Schedule (Full Extract)
The frequency with which the currently cached database extract is purged and a new extract is cached.
Tip Collibra recommends scheduling a daily refresh.
Sheets
Allows you to specify which sheets to include in the publication. You can hide sheets if you want to publish a dashboard without showing all the worksheets that were used to create it.
Tip To avoid clutter, consider clicking Edit and then clicking Only Dashboards.
Data Sources
Determines:
- Whether the data is embedded in the workbook or published separately.
- How users authenticate with data sources.
Tip Collibra recommends the following settings: Click Edit, and then:- In the Publish Type drop-down menu, select Embedded in workbook.
This enables users to view the report without having to authenticate themselves every time. - In the Authentication drop-down menu, select Allow refresh access.
This automatically refreshes the extract of the database. The frequency with which the cache is refreshed is determined by the value you enter in the Refresh Schedule field.
More options
Additional publication options. Include external files determines whether or not external files are included in the publication.
Note
- Only the DataMaturityDashboard_Lakebase.twbx file refers to external files. The Include external files option is not available for the other Tableau workbook files.
- Ensure that Include external files is selected, so that the images included with the Tableau workbook files are included in the publication.
- Click Publish.
The report is published to your Tableau Server or Online account.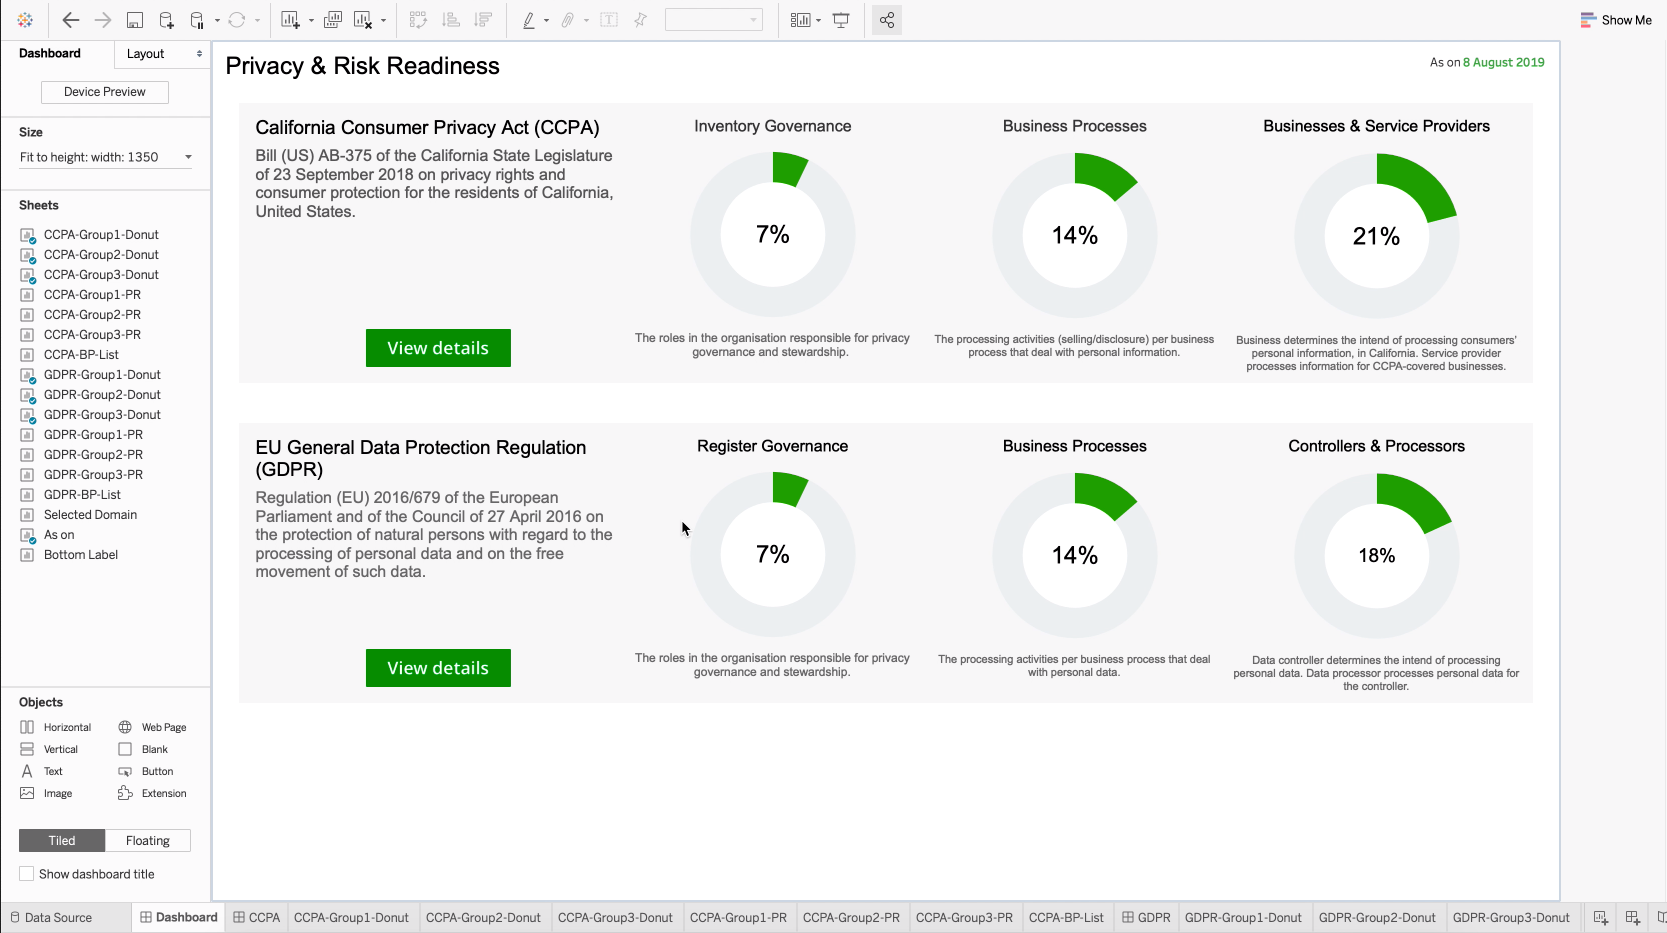 Tip On the Refresh Schedules tab, the refresh schedule event you configured is shown.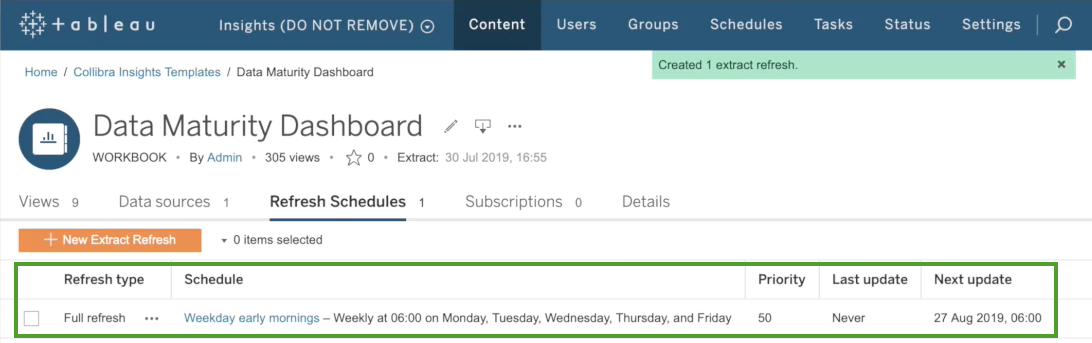
Step 4: Configure the reporting options in Collibra Settings
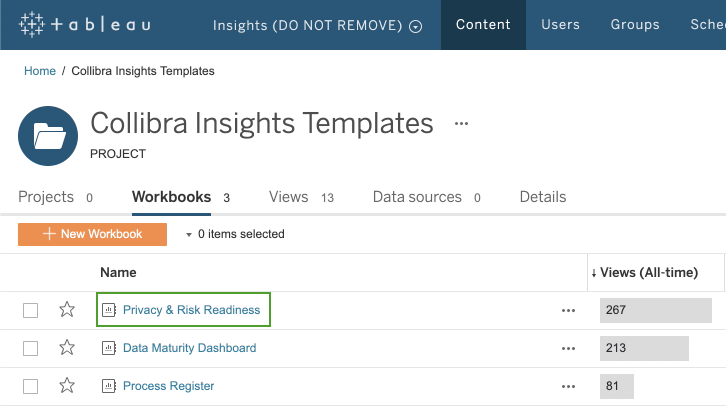
- On the Workbooks tab in Tableau, click one of the workbook files, for example, Privacy & Risk Readiness.
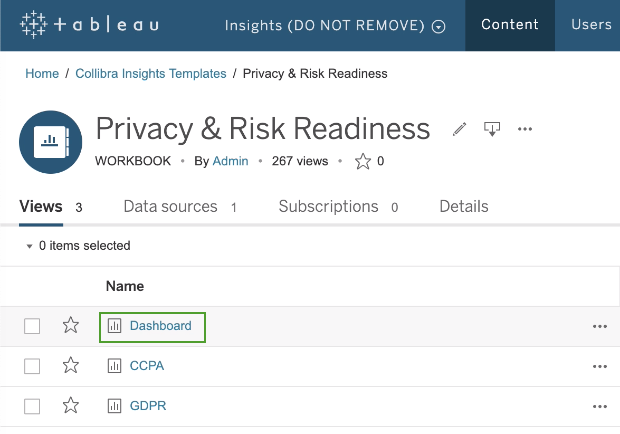
- Click Dashboard.
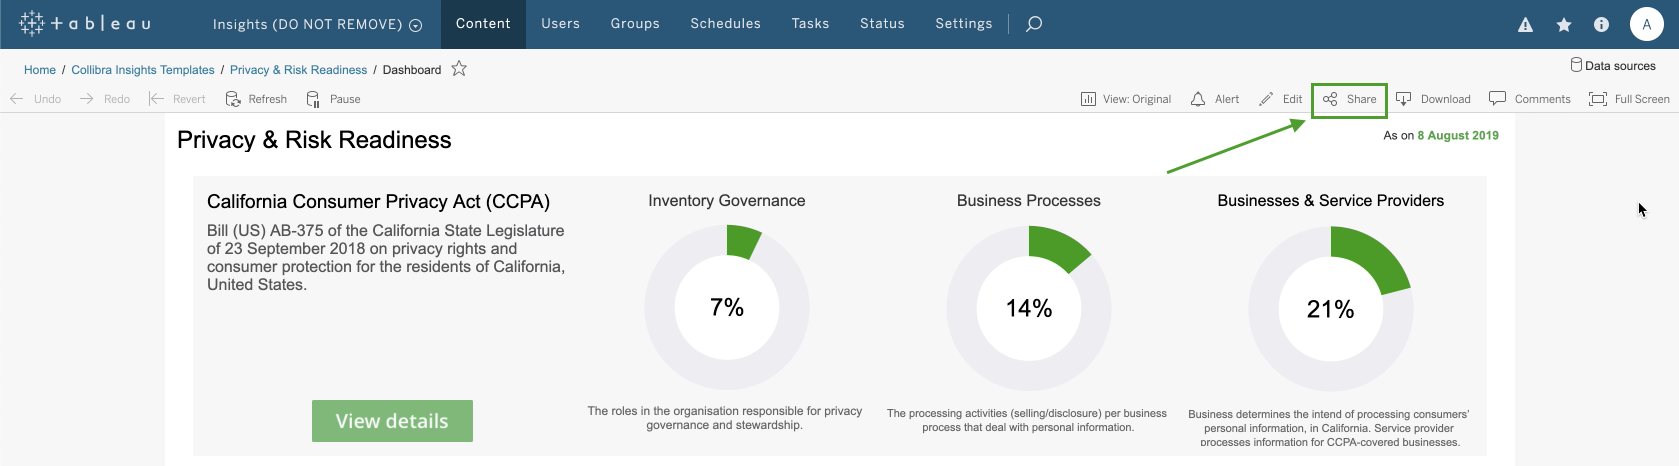
- Click Share.
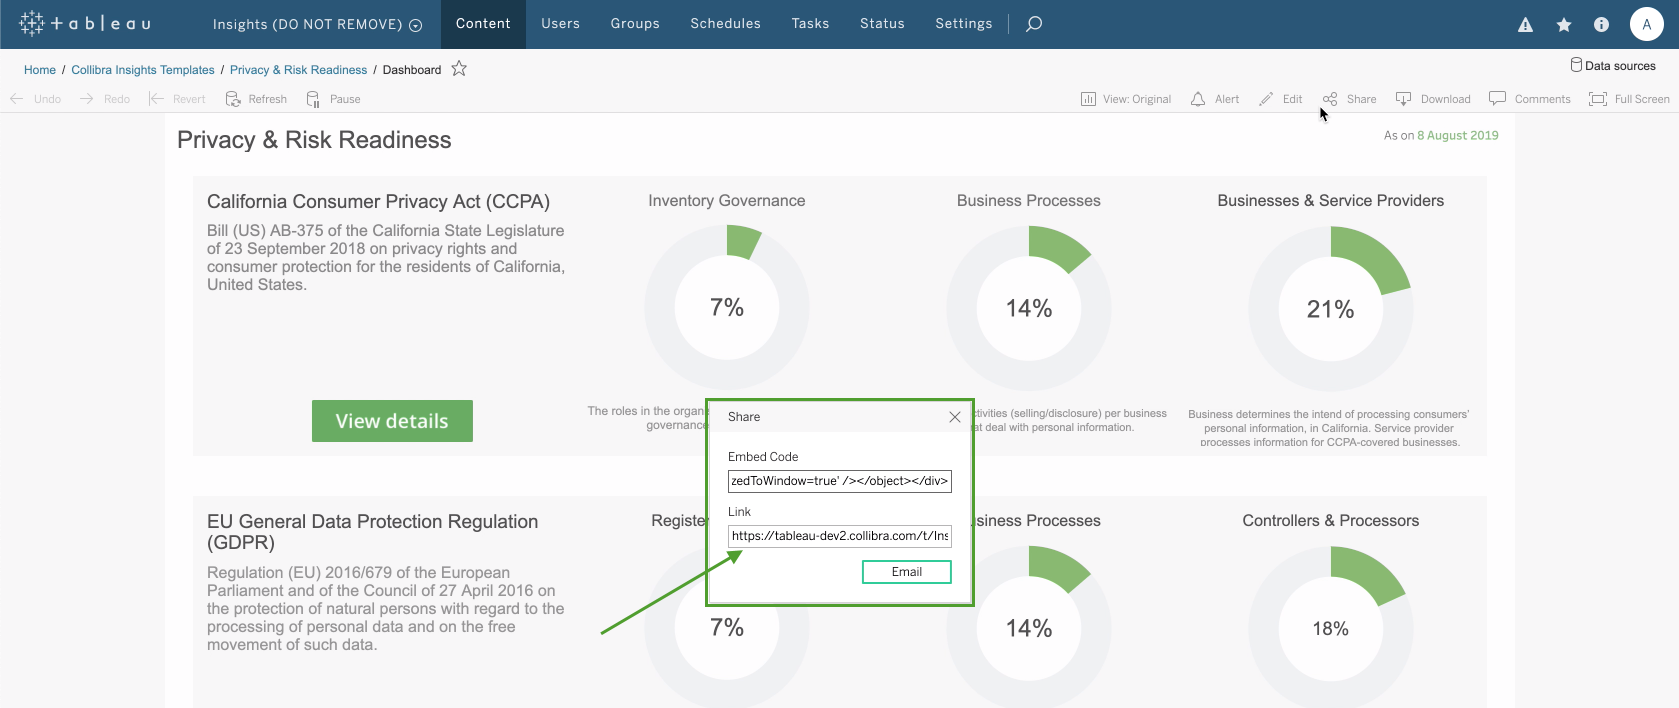
- In the Share dialog box, copy the URL in the Link field.
-
Open Collibra Console with a user profile that has at least the ADMIN role.
Collibra Console opens with the Infrastructure page. -
Click the Data Governance Center service of a Collibra environment.
The details of the DGC service are shown. - Click Configuration.
- Click Edit configuration.
- Scroll down the list of configuration options and click Reporting.
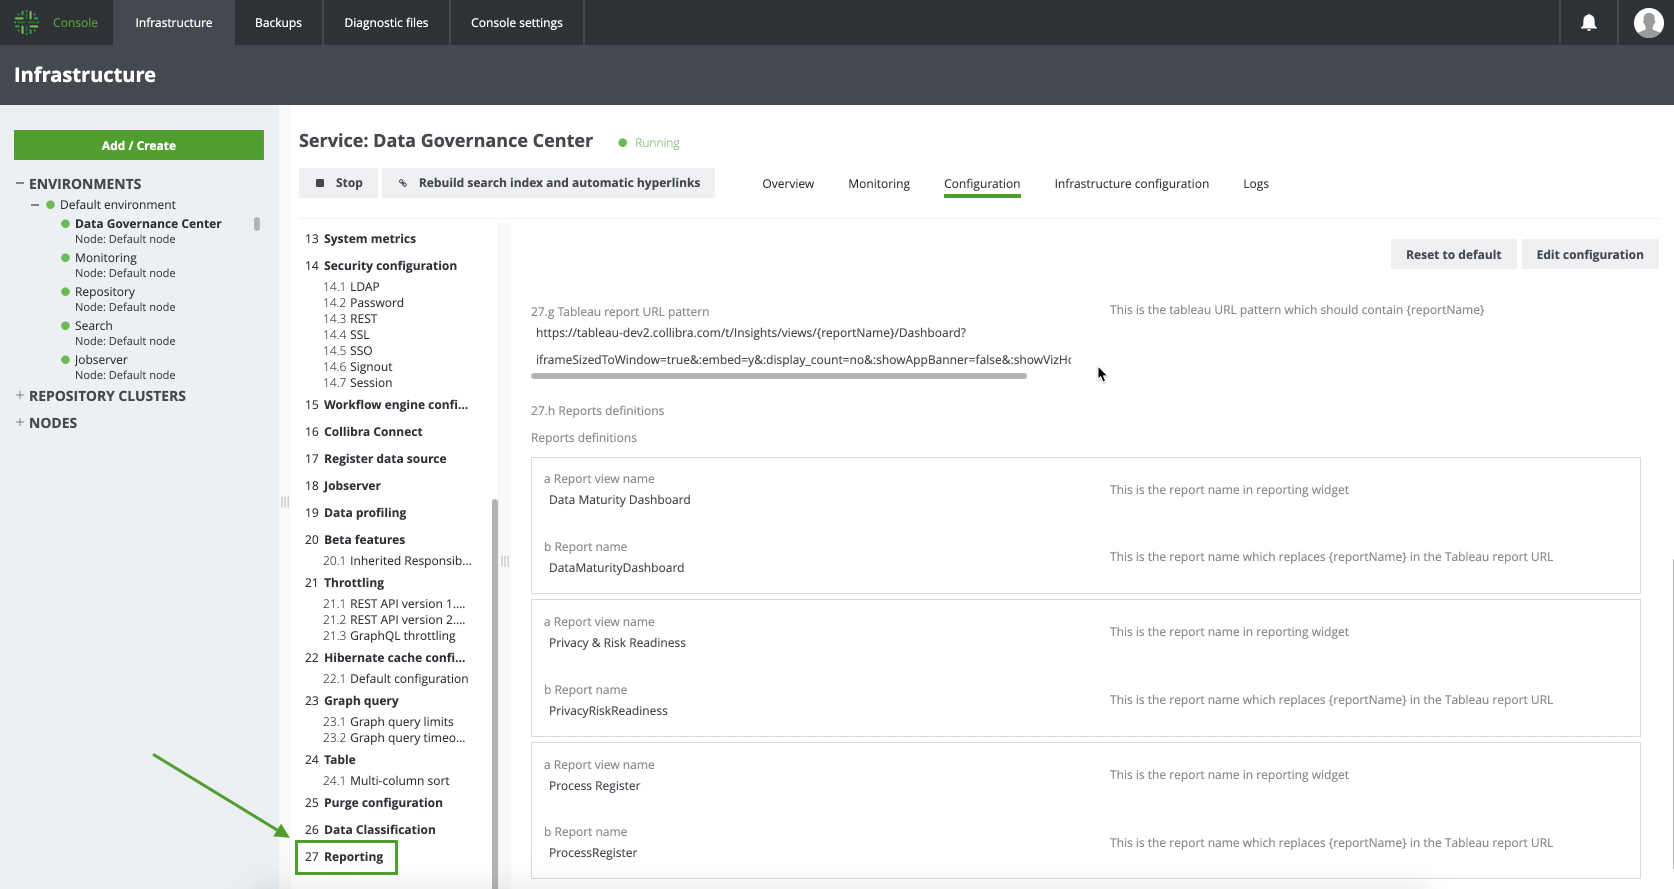
- In field Tableau report URL pattern, paste the URL that you copied from the Link field in Tableau.

- In the URL, replace the actual report name (such as DataMaturityDashboard) by {reportName}, for example:
https://tableau-dev2.<your-Collibra-Data-Intelligence-Cloud-environment-URL>/t/Insights/views/{reportName}/iframeSizedToWindow=true&... - Under Reports definitions, click Add.Note You must perform this step for all three reports.
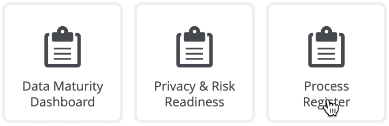
- In a Report view name, enter the name of a report as you want it to appear on the report button in the Insights widget, for example:
- Data Maturity Dashboard
- Privacy & Risk Readiness
- Process Register
- ln b Report name, enter the report name, for example:
- DataMaturityDashboard
- PrivacyRiskReadiness
- ProcessRegister
Tip Use the name as it appears in the URL of the Tableau report, for example, DataMaturityDashboard.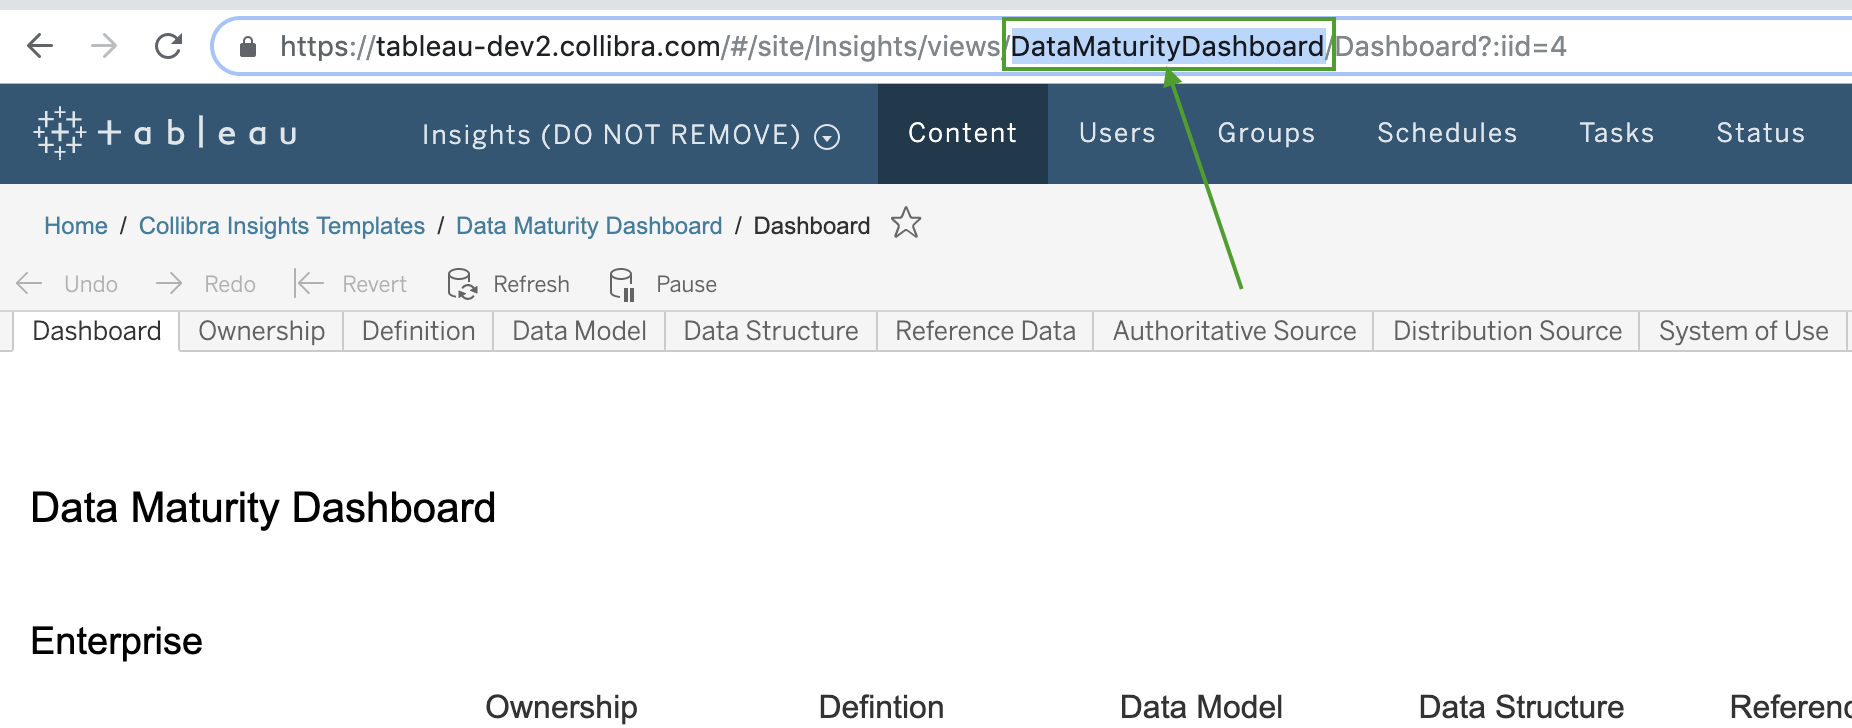
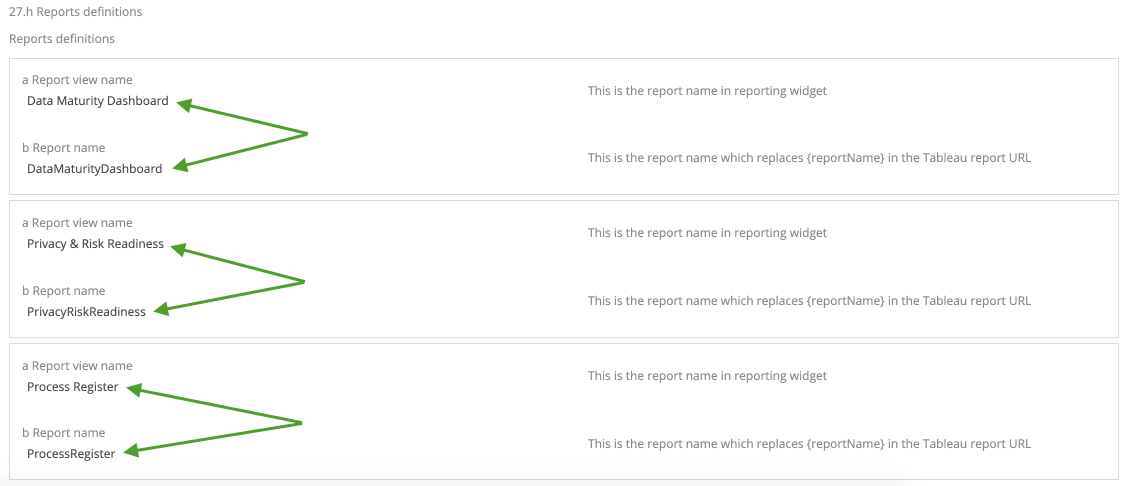
The settings in Console should look similar to the following image:

- Click Add, and then add the report definitions for the remaining two reports.
- In a Report view name, enter the name of a report as you want it to appear on the report button in the Insights widget, for example:
- Click Save all.
Step 5: Add a dashboard in Collibra and configure the Insights widget
Tip To facilitate the viewing of each report, we recommend that you add and configure a separate dashboard for each report. To do so, you must complete this step for each report.
- Create a dashboard.Tip When entering the required information, in the Layout field, select 1 Column.
- Click
 → Edit Dashboard.
 - Drag the Collibra Insights widget from the Widgets section to the dashboard.
The three reports that you configured in Collibra Settings are shown. - Select the report you want to show on the dashboard.
- Click Save.
- In the upper-right corner of the page, click Save.
The report is shown on the dashboard you created.
Optionally, you can: