Manage Page Editor Counter widgets
Counter widgets show statistics about your Collibra resources. You can specify the types of resources to monitor and configure warning and danger thresholds to indicate when users should take action. A common use case for a Counter widget is monitoring open issues, enabling users to easily track the number of open issues in your Collibra Platform and identify when that number becomes too high.
Important This widget is available only for Dashboard pages.
Prerequisites
You have the required permissions to edit the product page or dashboard.
Steps
- Go to the page where you want to add or edit a Counter widget.
- Click Edit.
- Place the widget:
- If this is a new widget, under Widgets, drag and drop Counter to the desired row on the page.
- If this is an existing widget, select the Counter widget and drag and drop it to the new position on the page.
- Select the Counter widget you want to configure.
- In the right-side panel, update the widget details:
- In the Title field, enter the name of the widget.
- In the Description field, enter a description of the widget.
- Select the Show description in a tool tip checkbox to show the description in a tooltip. This helps consolidate space on your page.
- In the Counters section:
- To add a new counter:
- Click
 .
. - Click the new counter.
- In the Title field, enter the name of the counter.
- In Data source, select the type of Collibra data source you want the counter to show. For example, Assets or Tasks.
Show me available data sources
Template Description Applications Number of Technology Assets. Approved Assets Number of assets whose status is Accepted. Assets Number of assets. Assets Created Past Day Number of assets created in the last 24 hours. Assets Created Past Month Number of assets created in the last 28 days. Assets Created Past Week Number of assets created in the last 7 days. Business Terms Number of Business Term assets. Code Values Number of Code Value assets. Columns
Number of Column assets.
Communities Number of communities. Data Assets Number of Data assets. Domains Number of domains. File Groups
Number of File Group assets.
Files
Number of File assets.
Governance Assets Number of Governance assets. Issues Resolved Past Day Number of Issue assets whose status became Resolved within the last 24 hours.
Note This counter does not show how many Issue assets were set to Resolved in the last 24 hours. It shows the total number of Issue assets that had the Resolved status at a specific point in time. By default, Issue assets are counted once every 24 hours. The counting interval can be edited in Collibra Console. Increasing the frequency of the counts, however, may negatively affect performance.
Issues Resolved Past Week Number of Issue assets whose status became Resolved within the last 7 days.
Note This counter does not show how many Issue assets were set to Resolved in the last 7 days. It shows the total number of Issue assets that had the Resolved status at a specific point in time. By default, Issue assets are counted once every 7 days. The counting interval can be edited in Collibra Console. Increasing the frequency of the counts, however, may negatively affect performance.
KPIs Number of Key Performance Indicators. Your Open Tasks Number of unfinished tasks for the user.
Note Unfinished is the status of the task, as documented in the workflow.
New Issues Number of Issue assets whose status is New. Open Issues Number of unresolved Issue assets. Unresolved Issue assets can have the following statuses:
- New
- Under Review
- Accepted
- Invalid
- In Progress
- Resolution Pending
- Pending
Open Tasks Number of unfinished tasks for all users.
Note Unfinished is the status of the task, as documented in the workflow.
Processes Number of Business Process assets. Reference Data Domains Number of Code-list domains. Reports
Number of Report assets.
S3 Buckets
Number of S3 Bucket assets.
S3 File Systems
Number of S3 File System assets.
Schemas
Number of Schema assets.
Tableau Dashboards
Number of Tableau Dashboard assets.
Tableau Projects
Number of Tableau Project assets.
Tableau Servers
Number of Tableau Server assets.
Tableau Sites
Number of Tableau Site assets.
Tableau Stories
Number Tableau Story assets.
Tableau Views
Number of Tableau View assets.
Tableau Workbooks
Number of Tableau Workbook assets.
Tables
Number of Table assets.
Task Duration Sum of all task durations. Users Number of user sessions that are currently active.
Note This number may be greater than the number of active licenses assigned to your organization, because every user may have more than one active session.
- In the Warning level and Danger level fields, set the visual representation of your warning and danger thresholds for set data source types. These numbers indicate when a data source type, such as an Issue asset, is at risk. Show me an example
Your organization sets their risk appetite threshold at 20 open issues. The risk appetite threshold is the level of risk your organization considers acceptable to achieve its goals.
- You set the Warning level to 10 for open issues. When there are 10 or more open issues, the counter widget turns yellow, indicating that an approved action should be taken before reaching the risk appetite threshold.
- You set the Danger level 20 open issues, which matches your risk appetite threshold. When there are 20 or more open issues, the counter widget turns red, showing that the risk appetite threshold has been reached or exceeded, and an approved action is required.
Note The threshold settings are designed for use with the following issue-related templates:- New Issues
- Open Issues
- Issues Resolved Past Day
- Issues Resolved Past Week
- In URL, enter a URL for a page related to the counter tile. The URL should lead to a page in your Collibra Platform.
Tip You can use the URL field to make the widget interactive. For example, when users click the URL, they are directed to a page where they can explore the content associated with the number shown on the widget or take remedial actions.
- Click
- To edit a counter, click an existing counter and update the information.
- To delete a counter, click
 next to the counter you want to delete.
 - To reorder counters, click and drag each counter you want to reorder.
- To add a new counter:
- In Refresh level, select how often you want the counter data to be refreshed:
- No refresh: The data is not refreshed, and the information remains static from the time you publish the page.
- 5 minutes
- 10 minutes
- 25 minutes
- 50 minutes
- 100 minutes
- Optionally, select
 above the component to copy and paste the component.
 - Optionally, select
 above the component to delete the component.
 - Click Publish to publish your changes.
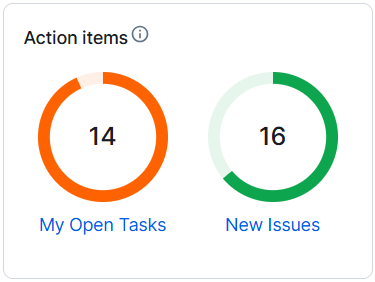
Example
You want to configure a Dashboard for your users that allows them to quickly identify tasks and issues when they sign in to their Collibra Platform.
Your organization has certain policies in place around task and issue management:
- A user shouldn't have more than 15 open tasks at any point in time. This is manage their workload and ensure their tasks are completed in a timely manner. If they have more than 15 open tasks, then they must reach out to their team lead for support.
- There shouldn't more than 25 Issue assets marked as new. This is to ensure that when a new issue is created, it is handled in a timely manner. If there are more than 25 issues, users should reach out to their team lead for support.
- You add a Counter widget to the page and add 2 counters to the widget.
- For the first counter:
- In Data source, you select Your Open Tasks. This shows the number of unfinished tasks for the user viewing the page.
- You set the Warning level to 15, indicating the user should consider taking action if they have 15 or more open tasks.
- You set the Danger level to 20, indicating the user must reach out to their team lead if they have more than 20 open tasks.
- For the second counter:
- In Data source, you select New Issues. This shows the number of Issue assets that have the status New.
- You set the Warning level to 20, indicating the user should consider taking action if they have 15 or more open tasks.
- You set the Danger level to 25, indicating the user must reach out to their team lead if they have more than 20 open tasks.
- Click Publish.