Findings
The Findings page is a dashboard that displays the results and health of a DQ job run. Findings lets you explore the details of a job run and gives you the ability to drill down into the various data quality dimensions to better understand your dataset.
Findings overview
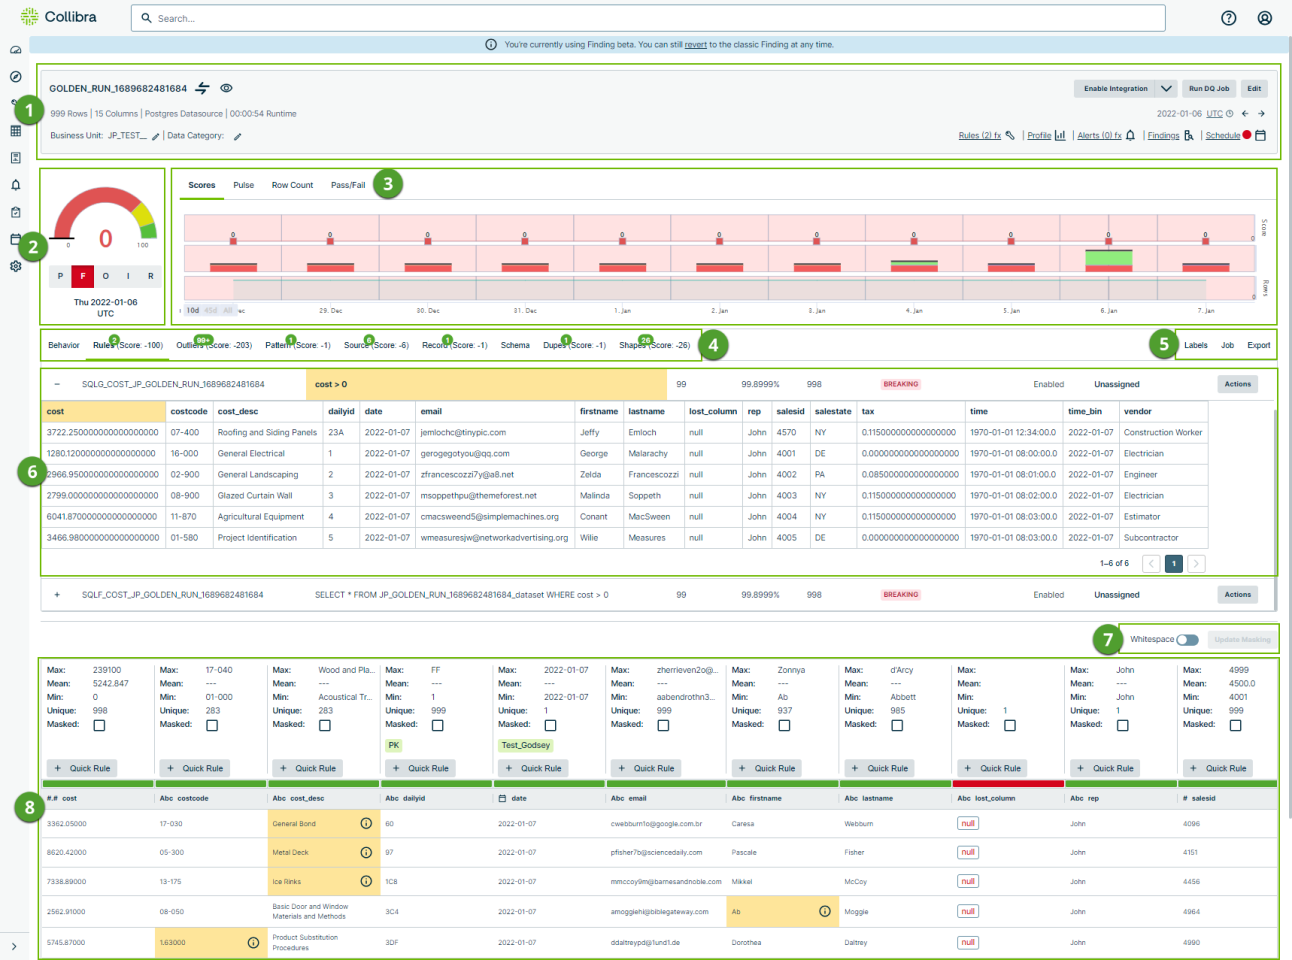
When Collibra DQ observes a change or anomaly, it records the finding for each dimension and includes a numeric indicator next to the tab where Collibra DQ detects the issue.
The following table provides an overview of the key elements of the Findings page with numbers that correspond to the image above.
| No. | Component | Description | ||||||||||||||
|---|---|---|---|---|---|---|---|---|---|---|---|---|---|---|---|---|

|
Metadata bar | A dataset anchor that empowers you with the ability to access crucial data quality components related to your dataset, such as its Findings, Profile, and associated rules and alerts. | ||||||||||||||

|
Data quality score |
The Data Quality score is an aggregated value between 0-100 that represents a summary of the integrity of your data. A score of 100 means that Collibra DQ does not detect data quality issues in your dataset. Conversely, a score of 0 indicates that Collibra DQ has observed enough potential data quality issues that it has down-scored the findings to the lowest possible value. Note The findings from each data quality dimension where Collibra DQ detects potential data quality issues contribute to the overall data quality score. Below the score meter are five clickable options.
|
||||||||||||||

|
Score chart view selector |
The Scores, Pulse, Row Count, and Pass/Fail tabs each provide different graphical representations of your data quality scores, run status, row count evolution, and pass or fail status over time. Note The times along the x-axis use random values that do not reflect or relate to the run ID of a given DQ Job run. |
||||||||||||||

|
Data quality dimension findings tabs | When Collibra DQ detects potential data quality issues for a given dimension, a numeric indicator shows how many issues were discovered and the data quality score impact aggregated from the findings. Click the tabs to reveal more details about the findings. | ||||||||||||||
|
Behavior
|
Automatically detected. Behavior is an assortment of behavioral observations based on Collibra DQ's AdaptiveRules, which automatically observe and adapt to changes in numeric representations of data over time, down-scoring any values outside the defined boundaries. | |||||||||||||||
|
Rules
|
Opt-in for detection. Rules are user-defined SQL conditions that help you identify and understand anomalies in your data, and ensure that your data is fit for use to meet your business requirements. | |||||||||||||||
|
Outliers
|
Opt-in for detection. Outliers are values that differ significantly from the rest of the data and may indicate bad or incorrect data. | |||||||||||||||
|
Patterns
|
Opt-in for detection. Patterns detect similarities among string values across columns and down-score any observations. | |||||||||||||||
|
Source
|
Opt-in for detection. Detects row count, schema, and cell value inconsistencies between the source file or table and the target file or table and down-scores any observations. | |||||||||||||||
|
Record
|
Opt-in for detection. Records detect rows of data that drop out of a data set and down-score any observations. | |||||||||||||||
|
Schema
|
Automatically detected. Schema detects changes to columns and data types and down-score any observations. | |||||||||||||||
|
Dupes
|
Opt-in for detection. Duplicates (dupes) are values that match other existing values in columns and can be set to detect exact and fuzzy matches. | |||||||||||||||
|
Shapes
|
Automatically detected. Shapes detect rare or inconsistent data formats in string columns and down-score any observations. | |||||||||||||||

|
Labels, Job, and Export tabs |
These three tabs let you do the following: |
||||||||||||||

|
Finding drill-in | Click data quality dimension tabs with findings to discover more insights about potential data quality issues. | ||||||||||||||

|
Whitespace and masking |
When you click the Whitespace toggle above and to the right of the Data Preview, gray rectangles highlight empty spaces between string data in the Data Preview. When you select the Masked checkbox option at the top of a Data Preview column and click Update Masking above and to the right of the Data Preview, the Findings page refreshes and masks column entries with "XXXXX" instead of displaying potentially sensitive data. |
||||||||||||||

|
Data Preview |
A preview of the columns in your dataset where you can view cell values, column data types, passing or failing columns, and where Shapes are detected. You can also add column-level Quick Rules, view sensitive labels, parent key columns labels, and column statistics, such as max, mean, in, and number of uniques. Note The data preview limit is 10 records and is non-configurable. |
What's next?
Drill down into your data quality findings to learn more about what Collibra DQ discovered and how the observations contribute to the overall data quality score of your dataset.
