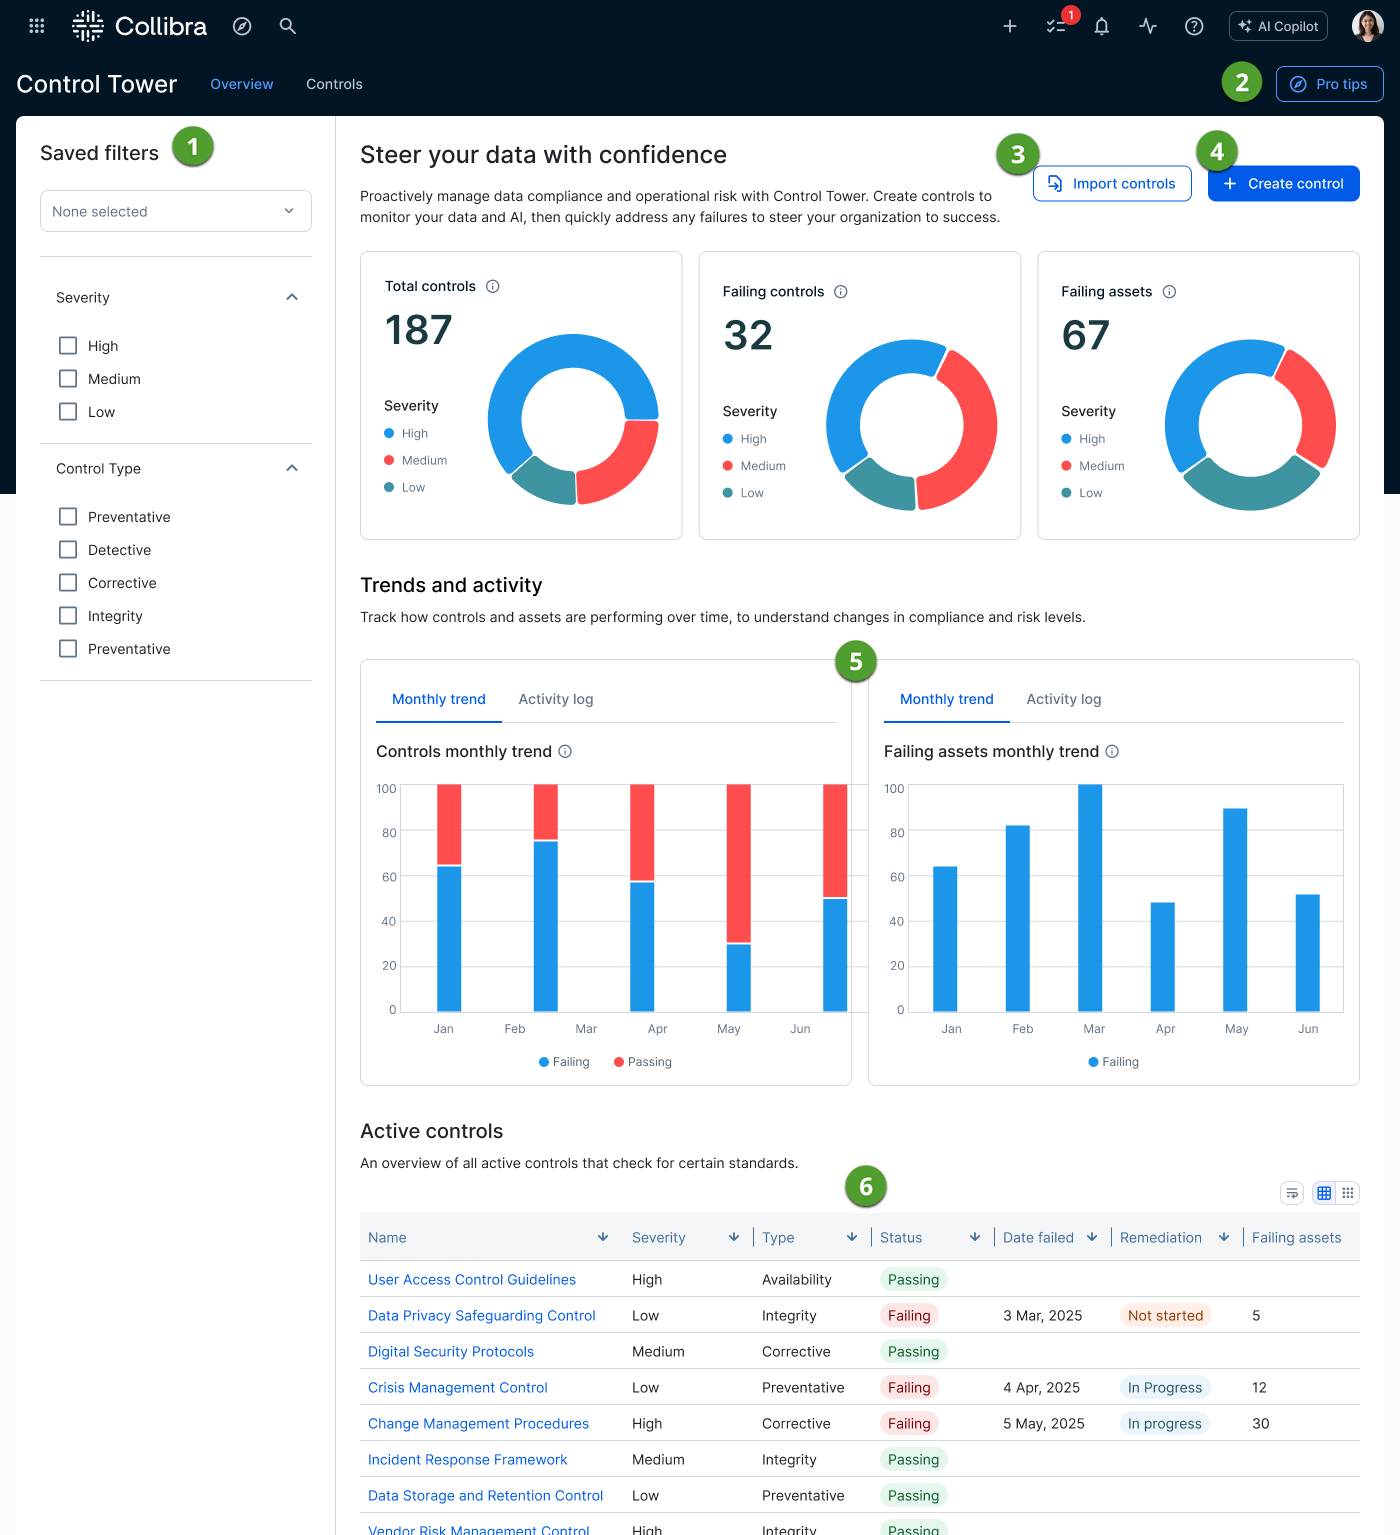
When you open Control Tower, you arrive on the Overview page. You can navigate from there to the Controls page.
The Overview page provides centralized monitoring for the evolution of your controls and the adherence of governed assets. Customization is not currently supported, bit it is a planned enhancement in our upcoming release cycles.
| No. | Element | Description |
|---|---|---|
|
|
Filters |
Severity and Control Type filters determine which controls are represented in the graphs. If no filters are selected, all controls in your Collibra environment are reflected in the monitoring graphs. You can save your filter configurations for future use. |
|
|
Pro tips button | Opens the Control Tower Overview panel, which provides quick-start information to the key capabilities of Control Tower and a video introduction. |
|
|
Import controls button |
Allows you to import predefined controls tailored for specific regulatory frameworks and industry use cases. These ready-to-use templates allow you to quickly implement monitoring for complex standards, by importing established logic directly into your environment. For more information, go to Import controls. |
|
|
Create control button |
Opens the Create a control dialog box for creating a new Managed Control asset. |
|
|
Monitoring charts |
The charts depict the following control counts and trends in your Collibra environment, taking into account any selected Severity and Control Type filters. For all charts, you can hover over any segment to see the exact count for that severity level. The charts display data for enabled controls only. Controls that are not enabled are not reflected in the charts.
|
|
|
Active controls |
Provides a granular, list-based view of your individual governance monitors and their current health. For a control to appear here as "active" its specific control query must be enabled on its corresponding Managed Control asset page. Key elements include:
|


Trend versus Activity
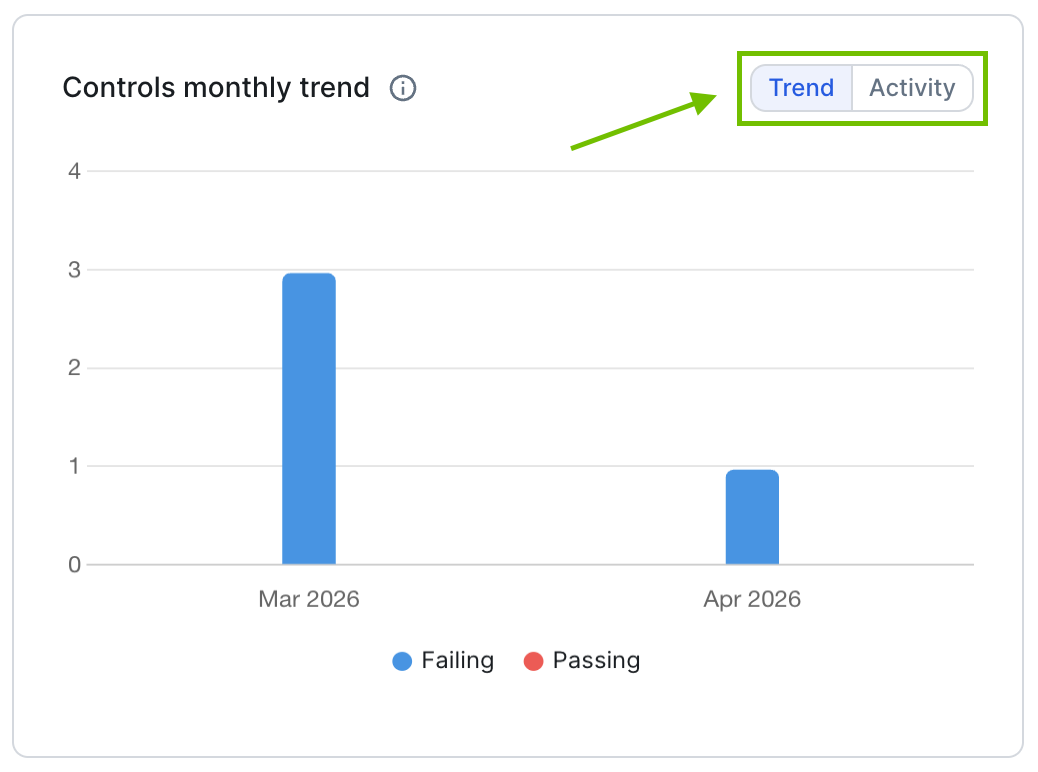
Trend is the default view. It shows a month-over-month comparison of your control statuses. Trend data is a point-in-time snapshot. Data is captured at the end of each month, or daily for the current month.
It uses a stacked bar chart to show the total number of controls that were Passing versus Failing, helping you visualize whether your overall control posture is improving or declining over time.
Switching to Activity shifts the focus from status to "events". It highlights the volume of changes or triggers occurring within your controls during that period, such as new controls being created, existing ones being modified, or manual overrides taking place.
Interactive details
The charts are interactive. You can hover your cursor over any colored section of a bar to trigger a detailed tooltip. The tooltip provides the exact "position" or count as of the end of that specific month, breaking down the precise number of failing controls, passing controls, and the total volume.
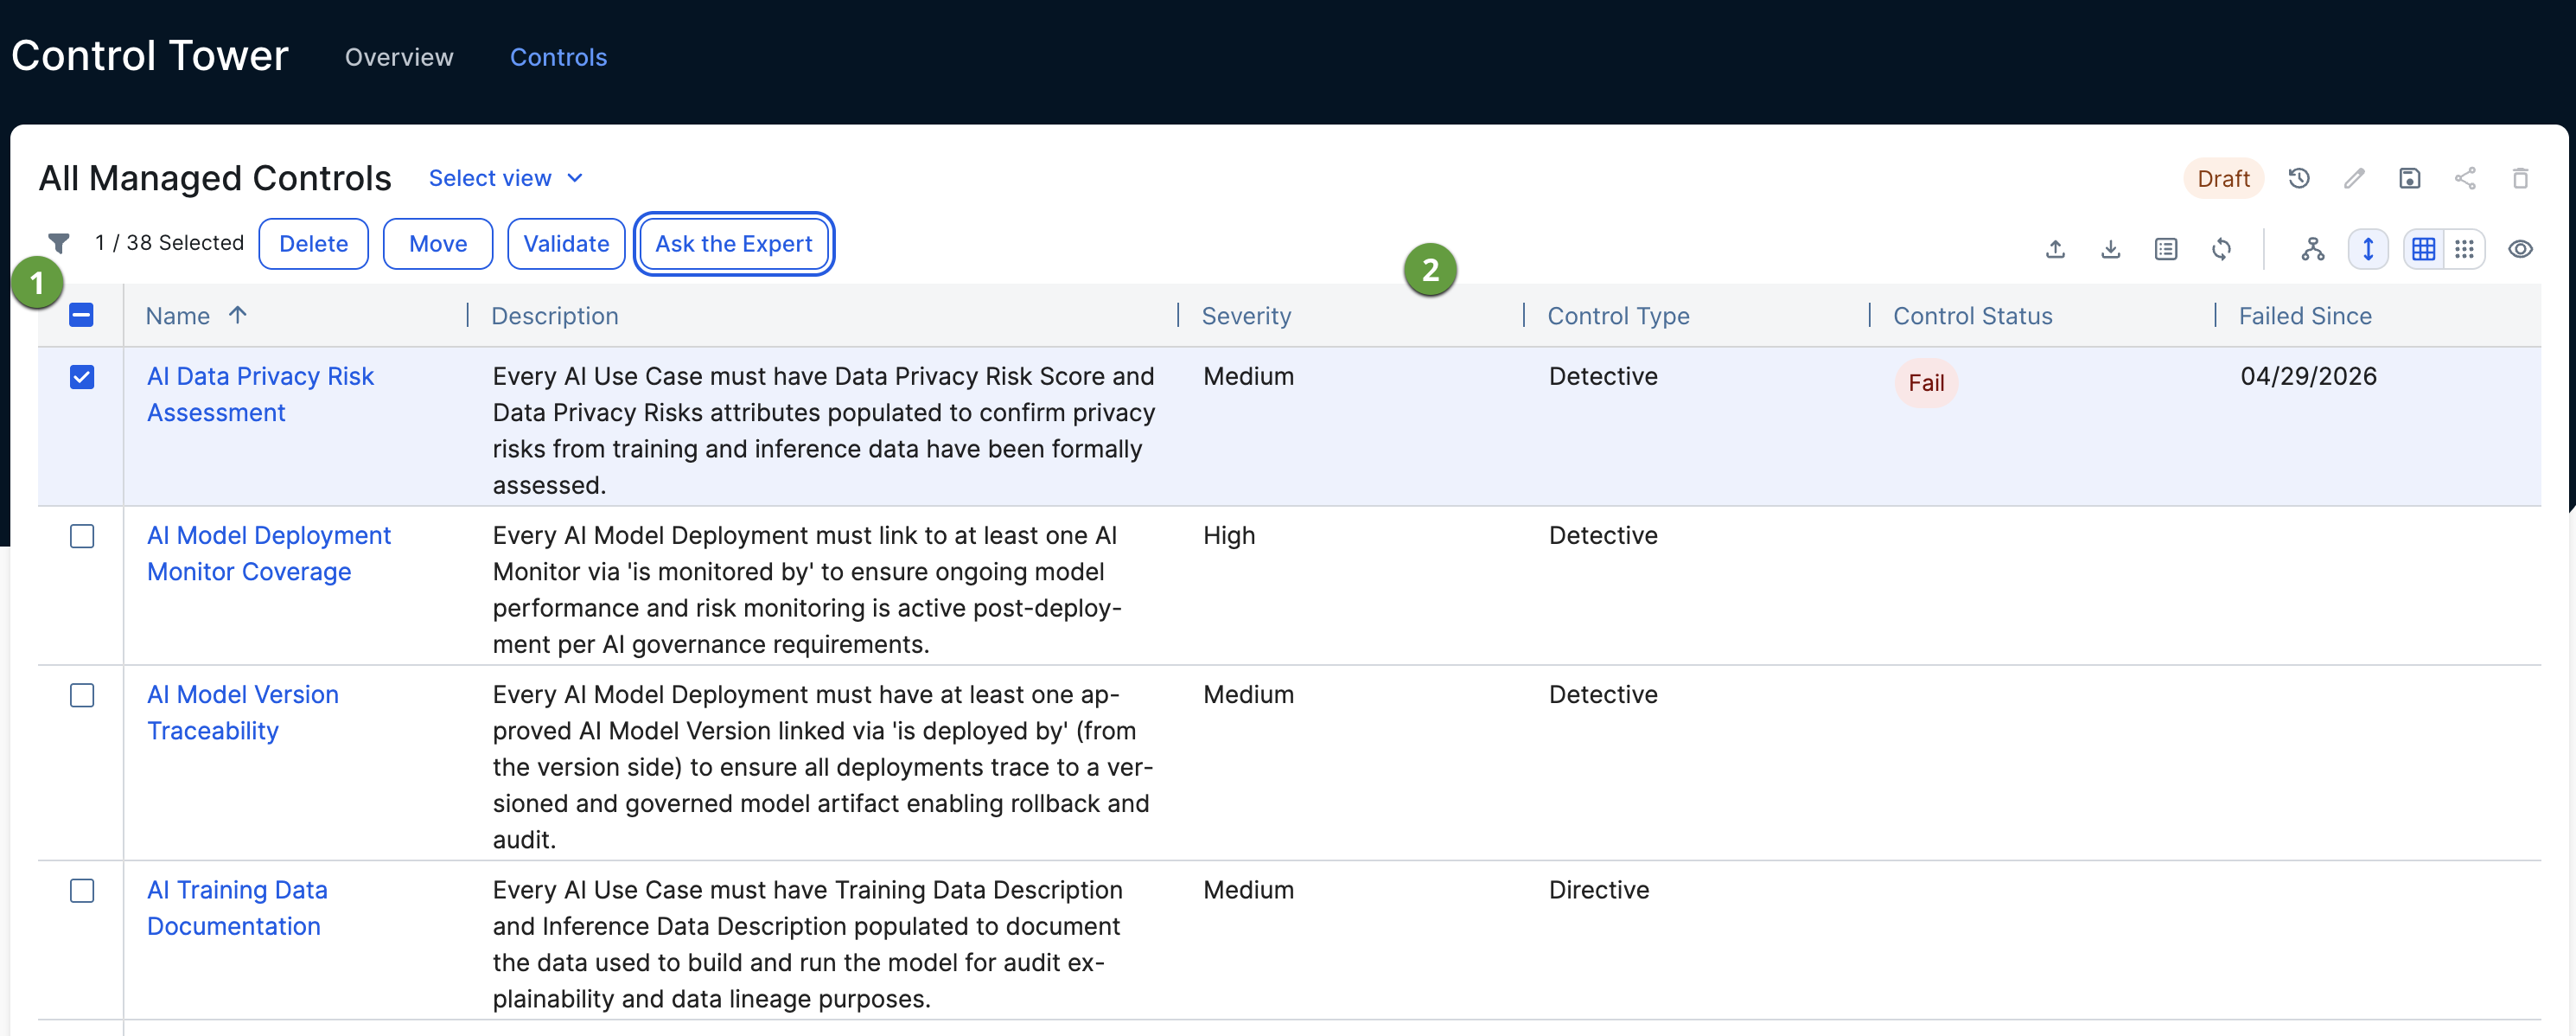
The Controls page provides a centralized environment for managing your individual governance monitors. This page allows you to organize and investigate your entire portfolio of controls through a flexible and actionable interface.
| No. | Element | Description |
|---|---|---|
|
|
Filter |
The asset filter enables you to quickly find the Managed Control assets you want by scoping the page content to specific projects or initiatives. |
|
|
Asset view of controls |
A comprehensive asset view, providing a granular list of every control in your environment:
To apply a different asset view, click Select view and select a view. You can also copy views, share views, and more, from this page. For complete information on working with asset views, go to Views.
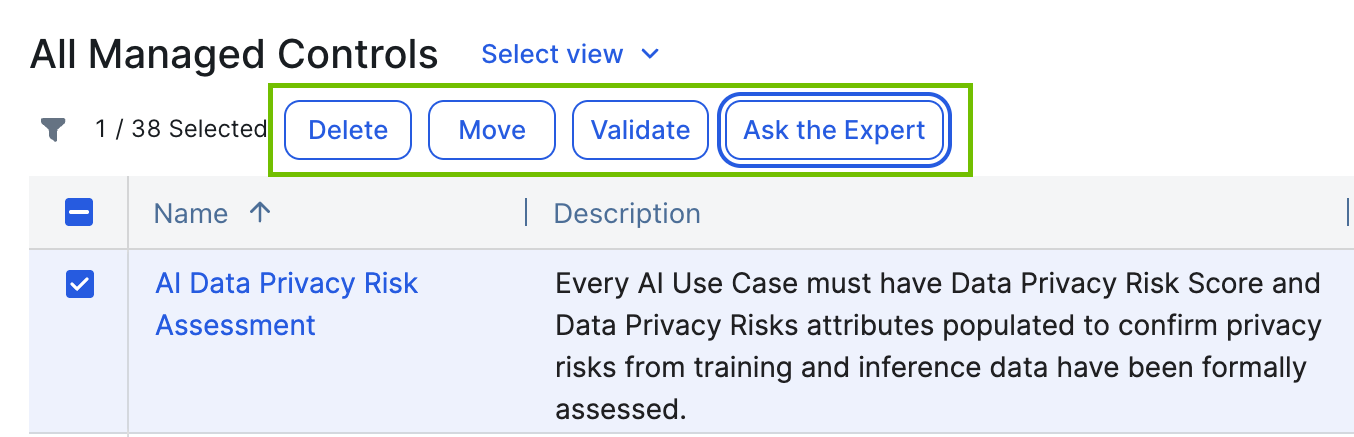
As shown in the following example image, if you select one or more controls, the interface dynamically shows available action buttons.
|