Choose an option below to explore the documentation for the latest user interface (UI) or the classic UI.
BI tool business stewards work with BI reports to make business decisions. Collibra Data Lineage offers BI tool business stewards several advantages:
- Easily find certified BI tool content.
- Shop for reports.
- Find where content is stored in your BI tool.
- Trace BI tool data to its sources.
- Get information about a BI report in a single location.
BI asset pages
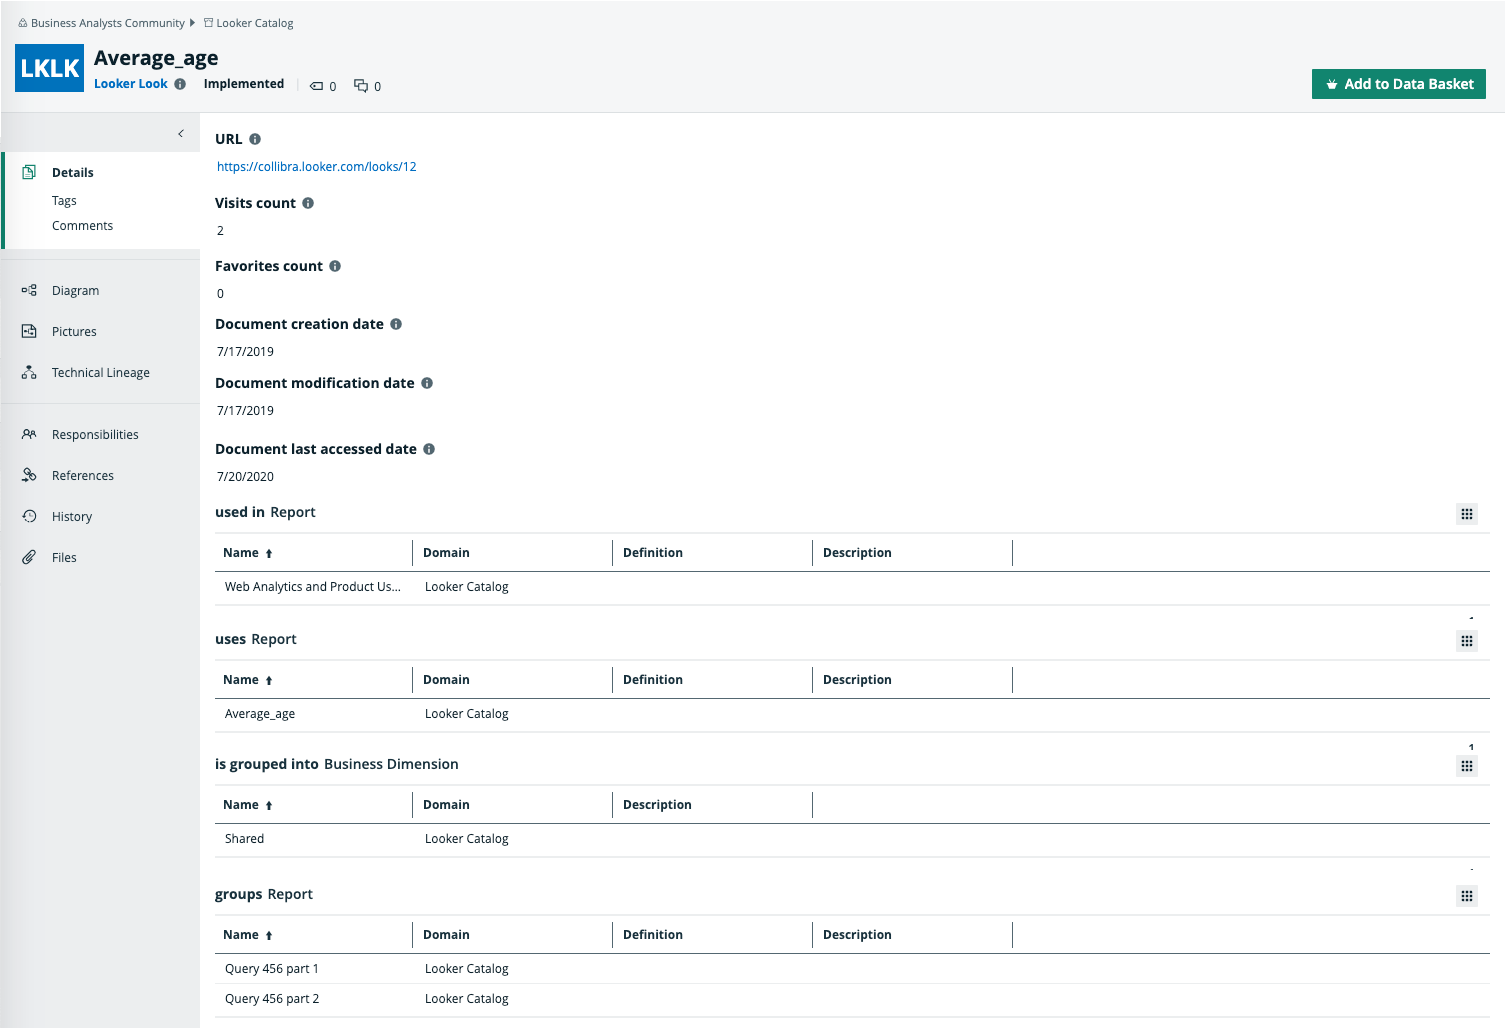
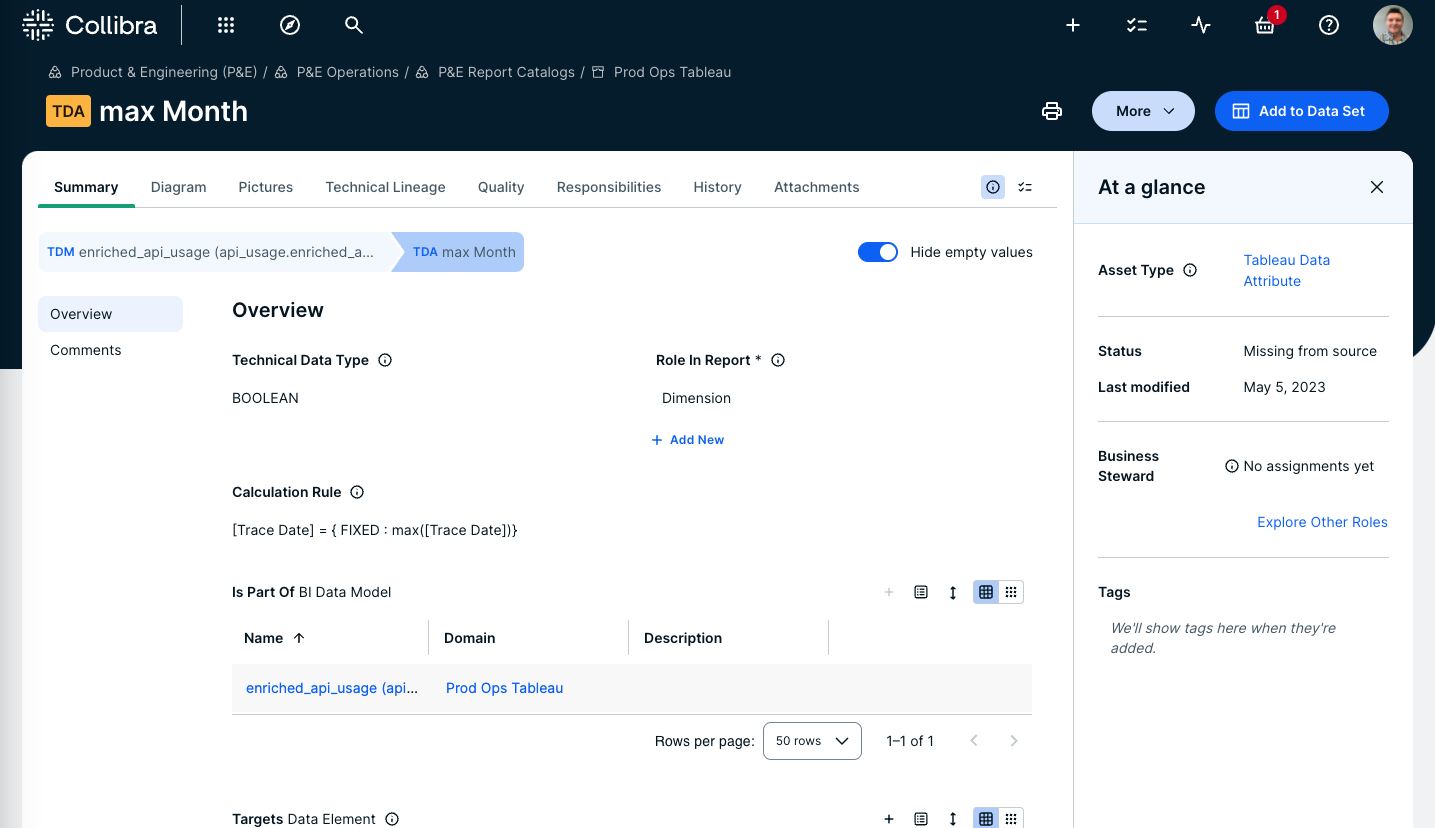
Depending on the asset type, the asset page shows different information ingested from your BI tool. For complete information, go to BI tool operating models.
You can find a specific asset pages by searching in Data Marketplace or by looking in the Data Catalog BI domain in which you ingested the metadata.
Details
An asset page contains attributes and relations to other assets. This information is synchronized from your BI tool. You can, however, add additional characteristics, tags or comments directly via the asset page.
If you want to use a report, you can add it to the Data Basket and check it out.


Business diagrams
Diagrams is a feature that allows you to interact with assets based on their relations in an easy-to-read diagram. Diagrams help you to quickly understand how assets are related. As such, the diagram can show a high-level presentation of a dataset or report. If the BI assets are stitched to registered assets in Data Catalog, you can also see the stitching results in the diagram.
Tip For each supported BI tool, we include the JSON code and instruction on how to create a diagram view of the BI tool operating model in your Collibra environment. For complete information, go to BI tool operating models, select your BI tool, and then scroll down to the section "Create an operating model diagram view".
Example The following diagram shows the Customer Sales Insights Tableau Workbook, which is stored in the Internet Sales Insights Tableau Project. The Tableau Workbook contains Tableau Report Attributes that have the CustomerSalesReporting Tableau Data Source as source. This Tableau Data Source is stitched to the CustomerSalesReporting Table asset in the SQL Server Cloud data source.
Report views
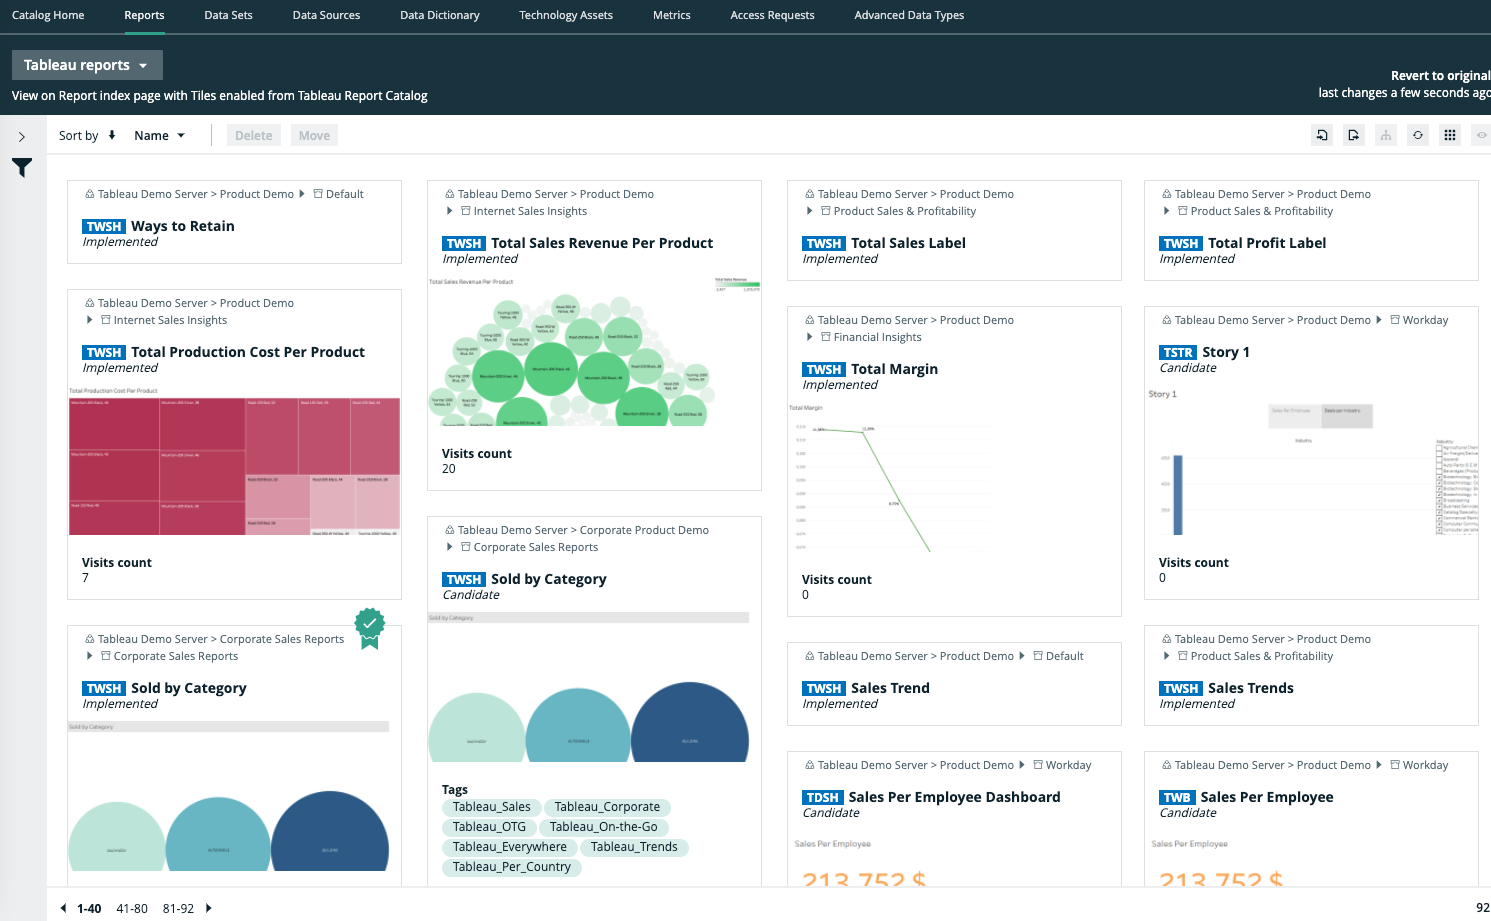
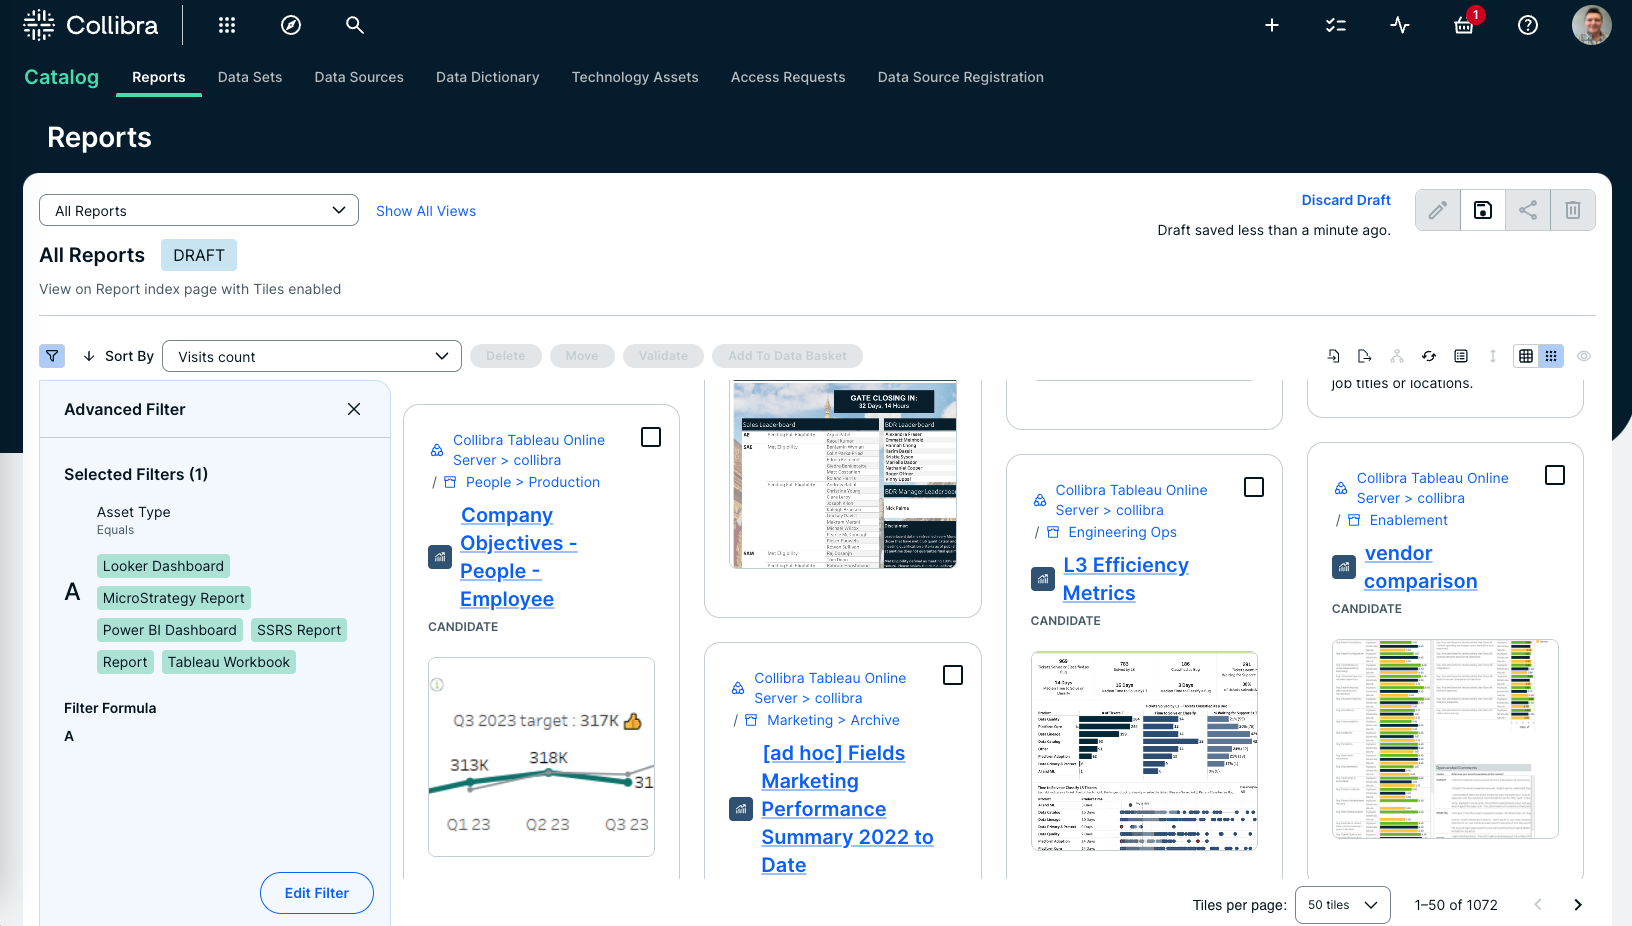
Collibra Data Lineage enables you to find all ingested BI asset types in a single location.
In the Reports tab page in Data Catalog you can see an overview of all BI Report assets and their children. Optionally, you can create a view with a filter to only show, for example, Tableau assets. This is useful if you quickly want to see all reports or if you want find specific reports, for example certified reports or the most frequented reports.

