When you register and synchronize a data source via Edge, you can follow the progress via:
- The Activities page.
- The database synchronization report (in preview).
This feature is available only in the latest UI.
About the database synchronization report (in preview)
The database synchronization report offers an overview of synchronization activities on registered databases. In the report, you get:
- Near real-time information on synchronization activities that are in progress.
- Details of all completed synchronization activities.
- The report includes information only for synchronization activities of JDBC data sources and is available only if the scalable ingestion flow is active in your environment. For more information about the scalable ingestion flow, go to Announcements or About synchronizing schemas.
- This feature is in preview and is available only in the latest UI.
Open the database synchronization report (in preview)
-
On the main toolbar, click
→
 Catalog.
The Catalog homepage opens. -
In the tab bar, click Integrations.
The Integrations page opens. - In the Data Source Registration tab, click the Database Synchronization in real time link.
The report opens.
You can also open the database synchronization report by clicking the link in the notification that shows when you start a synchronization activity.
Available information in the database synchronization report (in preview)
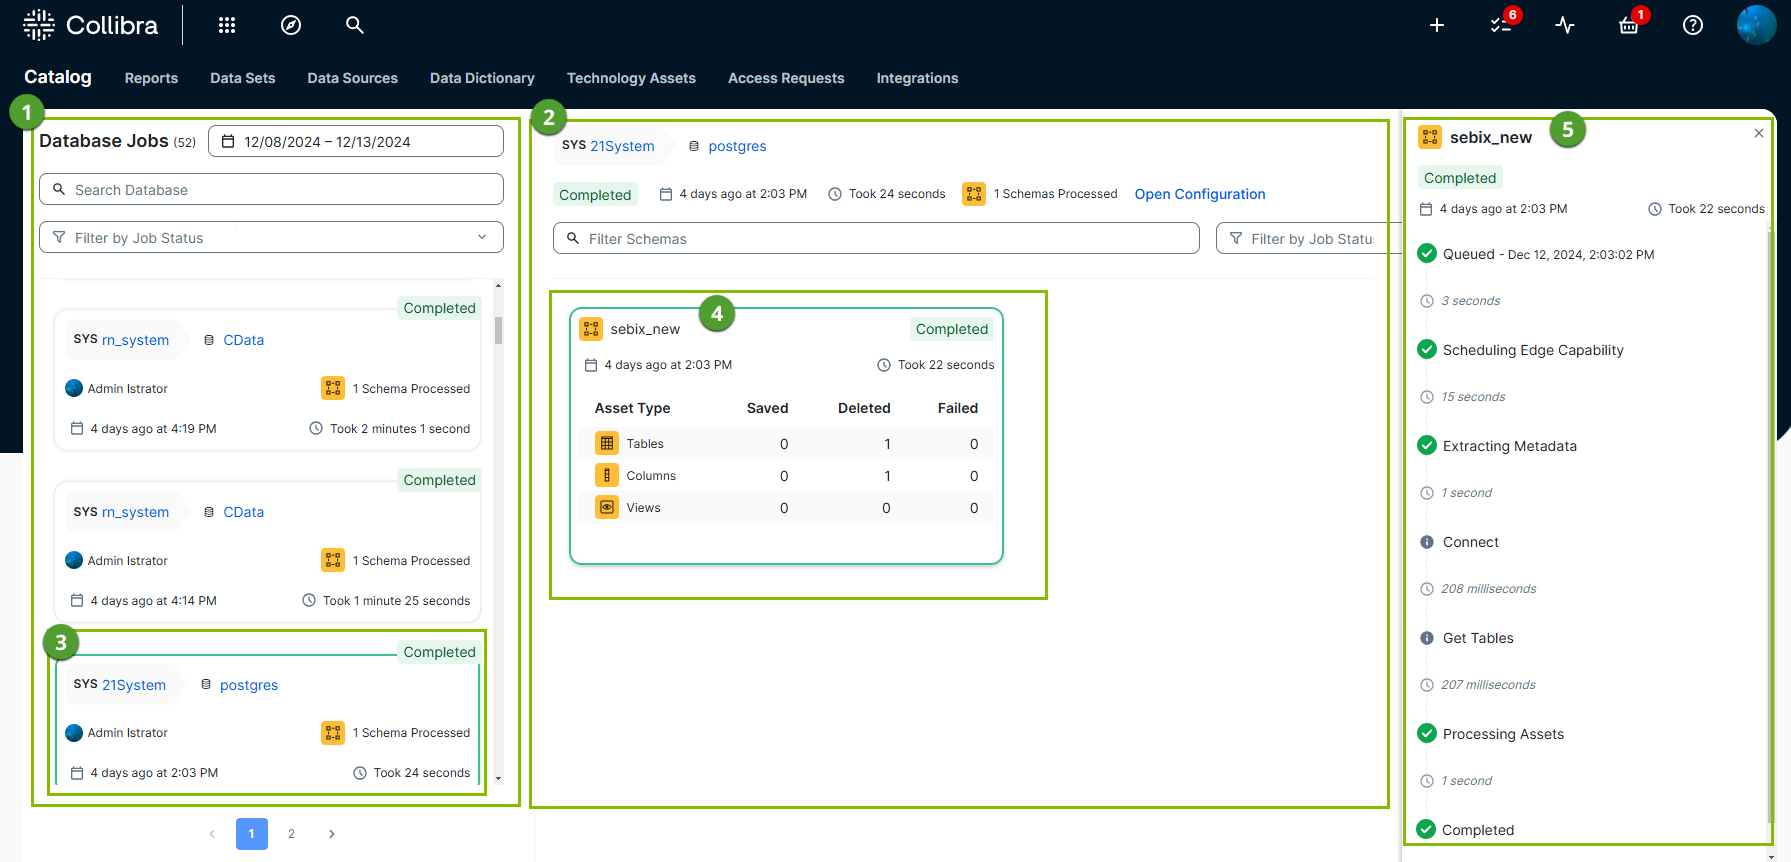
When you open the database synchronization report (in preview), by default, all database jobs of the current day are shown. If you open the report from a synchronization activity notification, the details for that job are immediately selected.

The database synchronization report consists of the following main areas:
-
 : Database jobs list:
This list shows the jobs that are in progress or completed based on the date range, database, and status you selected.
You can:- Request more jobs by changing the date range.
- Search for a specific database based on the name.
- Filter the list of jobs based on the job status: Completed, Failed, Running, Waiting, or Completed with failures.
- The status,
- The System asset name,
- The Database asset name,
- The number of schemas that are processed by the job,
- When the job started and by whom,
- How long the job took.
-
 : Database job details
This area shows the details of the selected database job, including general information and schema-specific information.
For each schema that is processed in the database job ( ), you get:
- The status,
- The Schema asset name,
- The number of tables, columns, views, and foreign keys saved, deleted, or failed,
- When the schema job started,
- How long the job took.
From the database job details, you can also open the database configuration to run the synchronization again.
-
 : Schema processing details
This area shows the details of the selected schema job. You get:- The status,
- The Schema asset name,
- When the schema job started,
- How long the job took,
- A detailed list of all events in the schema job, which include both Collibra and Edge events.
The following events are visible:- Queued: The schema job is waiting to be processed.
- Scheduling Edge Capability: The schema job is planned to start by the Edge site.
- Extracting Metadata: The Edge capability is running the synchronization. This event includes subevents, such as "Connect to the data source" and "Get the tables".
- Processing Assets: Data Catalog is getting updated.
- Completed: The schema job is finalized.
Tip- The selected schema job is marked with a colored border. (
 ).
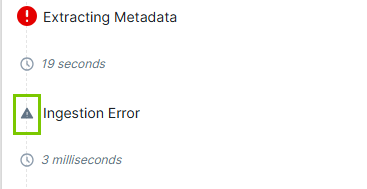
). - If an event fails, click the error icon to get more details about the error.
