Review the logs
Tip Capability-level logs (Stage 2/3) are not saved by default. To save the capability logs, set Debug to TRUE for the capability in the Add a data quality capability.
Tip In addition to the logs available on this page, you can access the same (and more granular, debug-level) logs directly from your Edge site's Kubernetes cluster. This can be useful when troubleshooting data source–specific issues, such as permission errors, without needing to open a support case. See About Edge security for details.
Overview of the Logs tab user interface
The following image and sections describe the key functional areas of the Logs tab.
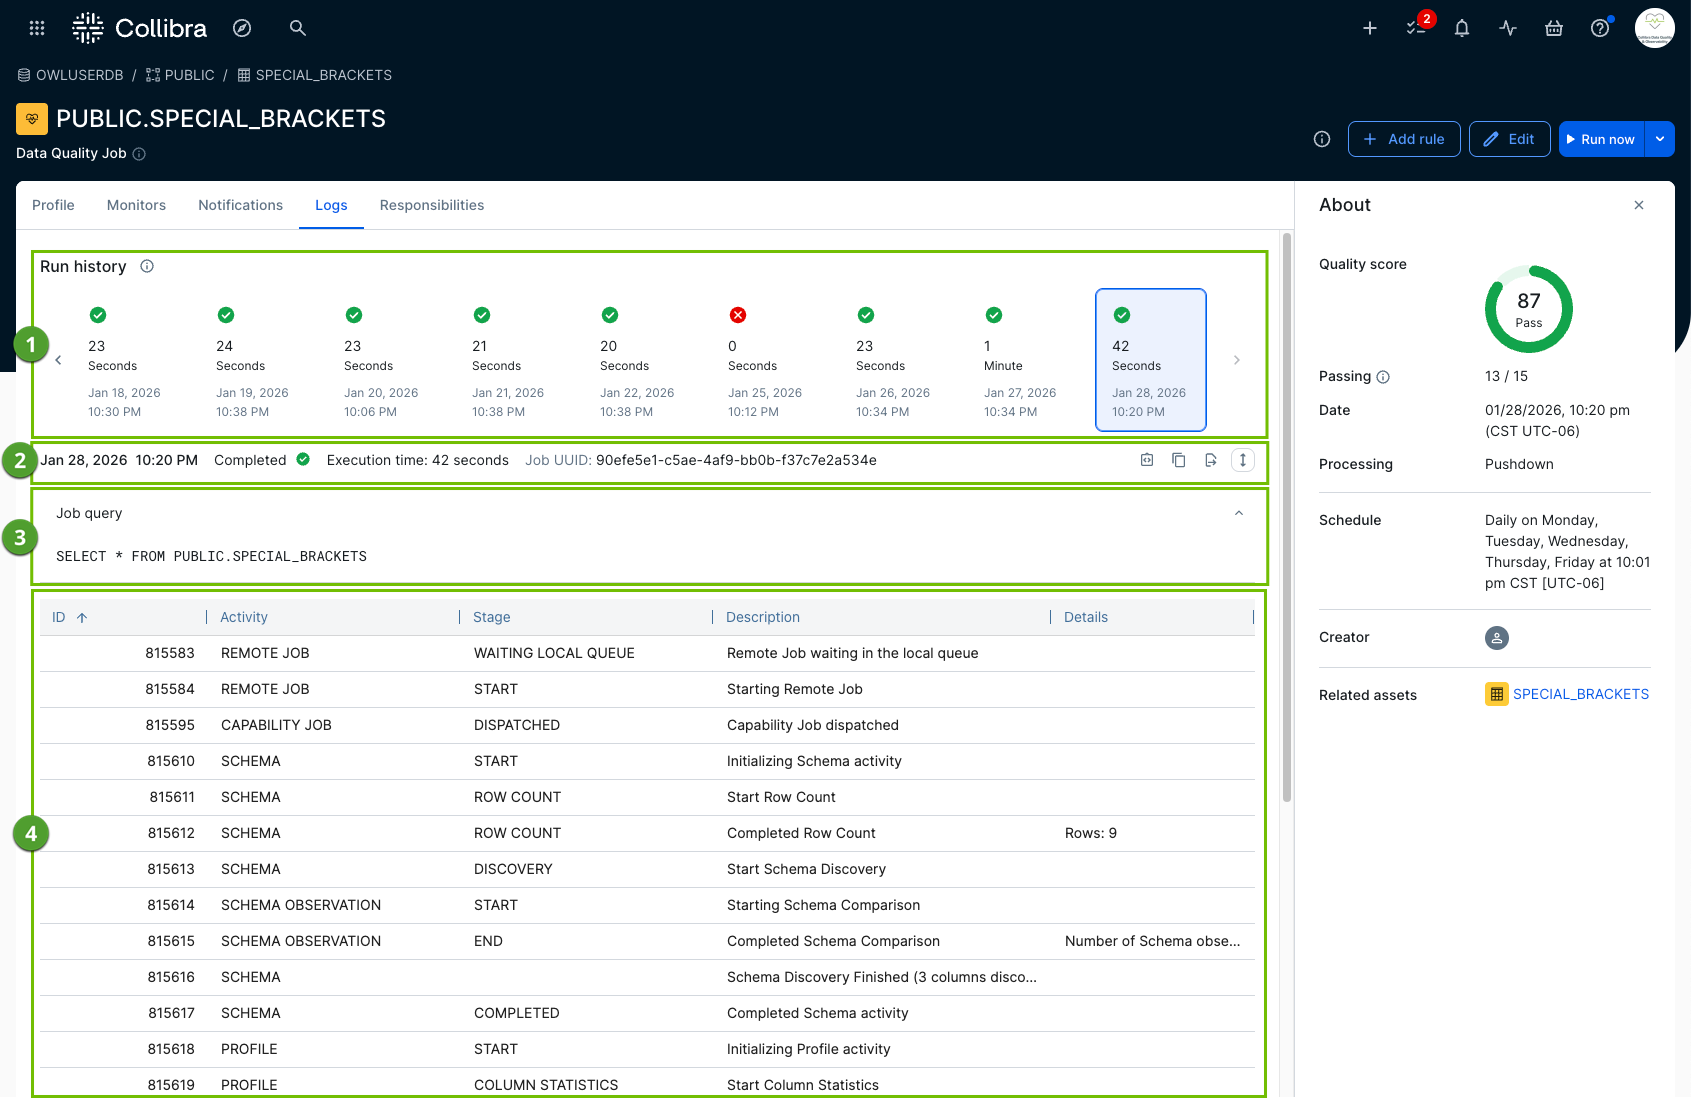
Run history
Run history ( ) shows the success and failure history of your job runs in a chart or list display. It also indicates the execution time for each run.
Run metadata, Job UUID, copy, and export
This section ( ) provides the various metadata of a job run log, including run date, job status, execution time, and the Job UUID.

This section provides options to perform the following:
| Action | Description |
|---|---|
 Open logs Open logs |
Open the execution logs in a new window to triage any issues. For pullup jobs, the log options include Spark submit logs and Spark driver logs. You can also view executor logs for pullup jobs by searching for the job ID followed by executor in your preferred monitoring application. For pushdown jobs, the log option includes Stage 2 logs. The number of days the logs are retained before being removed is controlled by the Platform log retention setting. Note If the capability pod never started or was forcefully terminated, such as due to insufficient Edge cluster resources, Stage 2 and Stage 3 logs won't exist. Instead, the job log table will contain a short diagnostic log entry, typically an exit code (such as 255) with a brief description. In this case, the job log table is the only location where this information appears. However, if the capability pod started but failed due to an issue, such as a SQL or permissions error, Stage 2 and Stage 3 logs will be populated as expected. |
 Copy query to clipboard Copy query to clipboard |
Copy the job query to your clipboard. |
|
|
Copy the log table contents to your clipboard. |
|
|
Export the log table contents as a CSV file. |
|
|
Click to wrap the text onto multiple lines. Click again to collapse the text. |
 Copy logs to clipboard
 Export to CSV
 Wrap text
Job query
The job query ( ) shows the specific SQL query that the system executes for the selected run.
Log details table
The log details table ( ) shows the job log for the selected run. It includes insightful details, such as the specific activities the system performs during the execution of a job and any errors or exceptions that occur. The number of days the logs are retained before being removed is controlled by the Job log retention setting.