Important
- This feature is available only in the latest UI.
- This feature is available only when you have an active integration with Data Quality & Observability Classic.
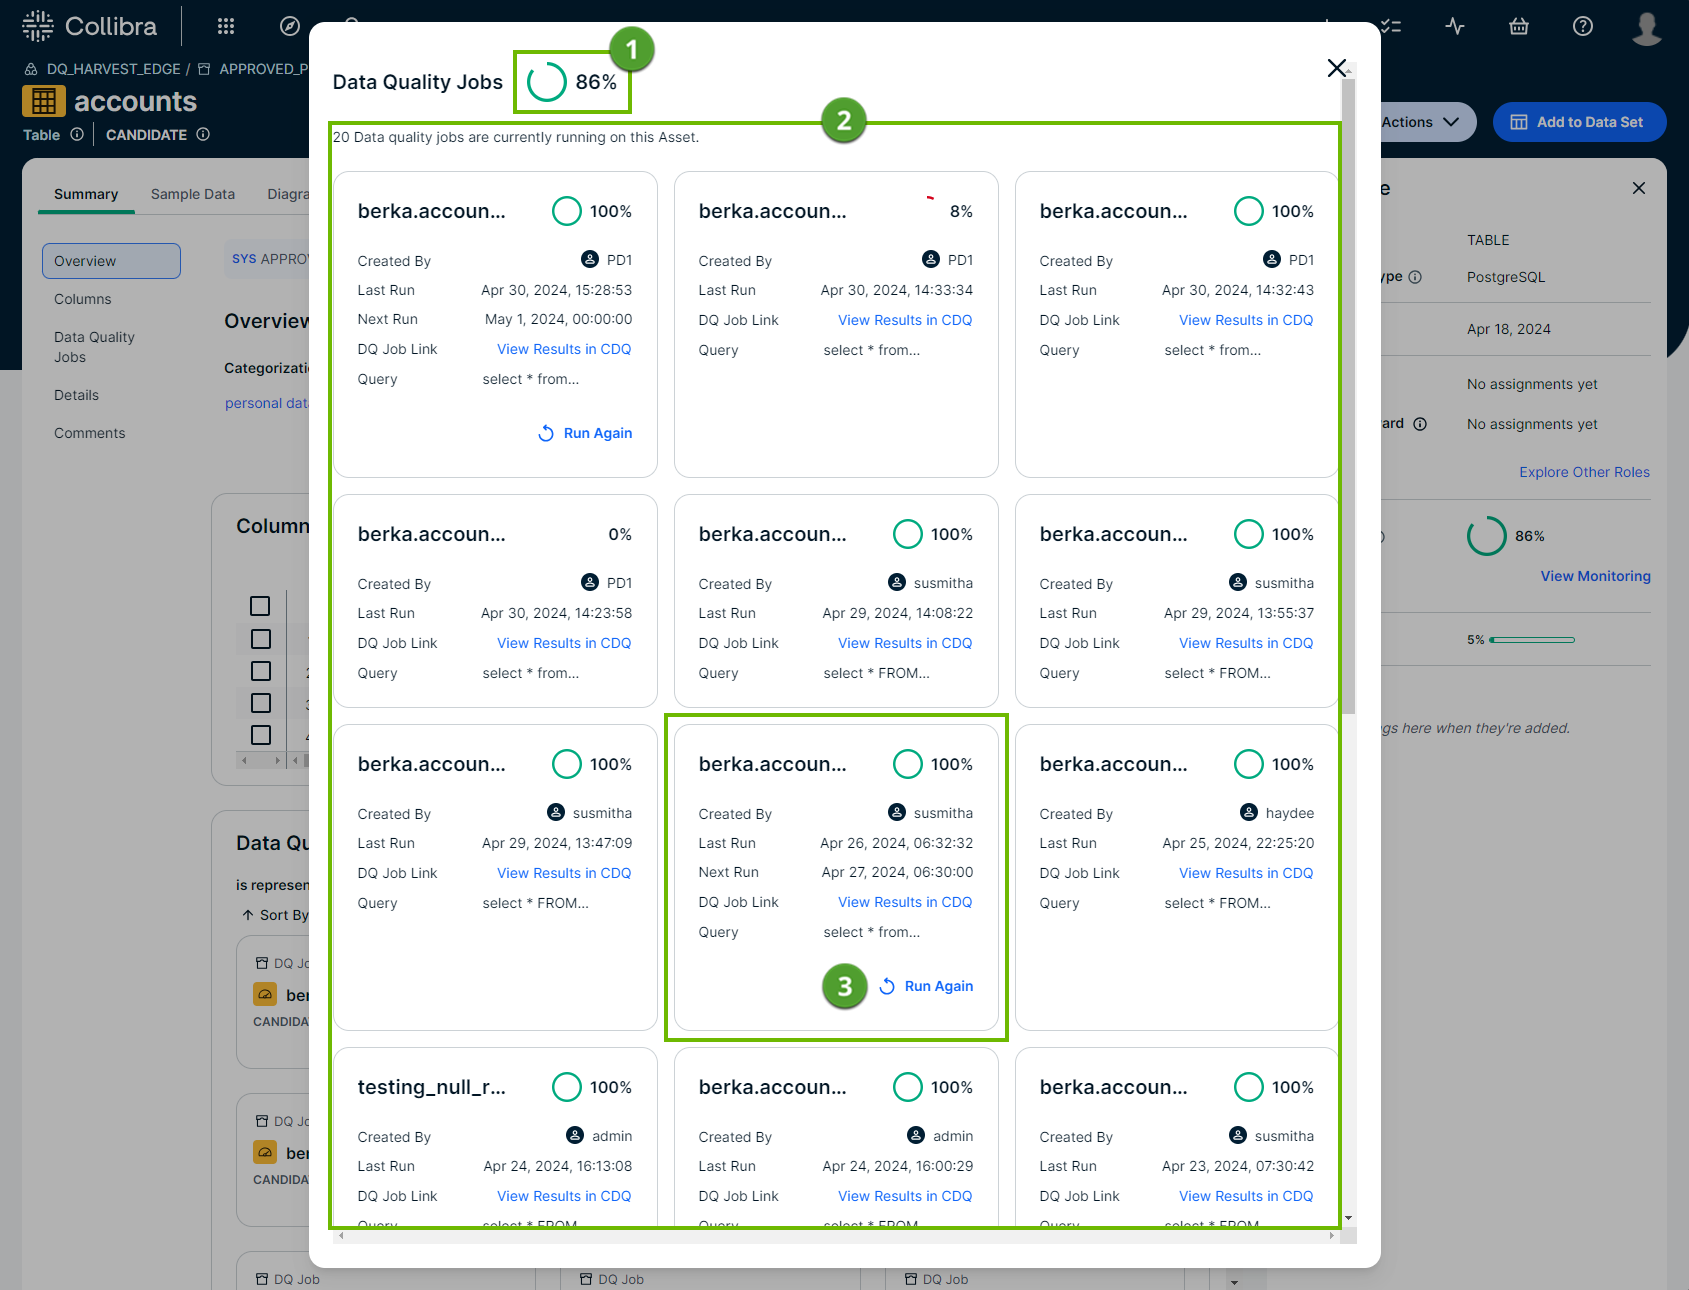
The View Monitoring link in the At a glance sidebar opens a modal that shows key data points of data quality jobs running on a Table asset. If the At a glance sidebar is hidden, click ![]() .
.
| Number | Section | Description |
|---|---|---|

|
Aggregate data quality score | The aggregate score of all jobs running on the Table asset. When a new job runs on this asset, this score updates to include the score from that run in its aggregation. |

|
Total data quality jobs | The total number of data quality jobs running on the Table asset. |

|
Data quality job overview |
Each tile represents an individual data quality job running on the Table asset. By default, each tile shows the following details:
When a job is configured in Data Quality & Observability Classic to run on a schedule, the tile shows the default information about the job along with the following details:
|