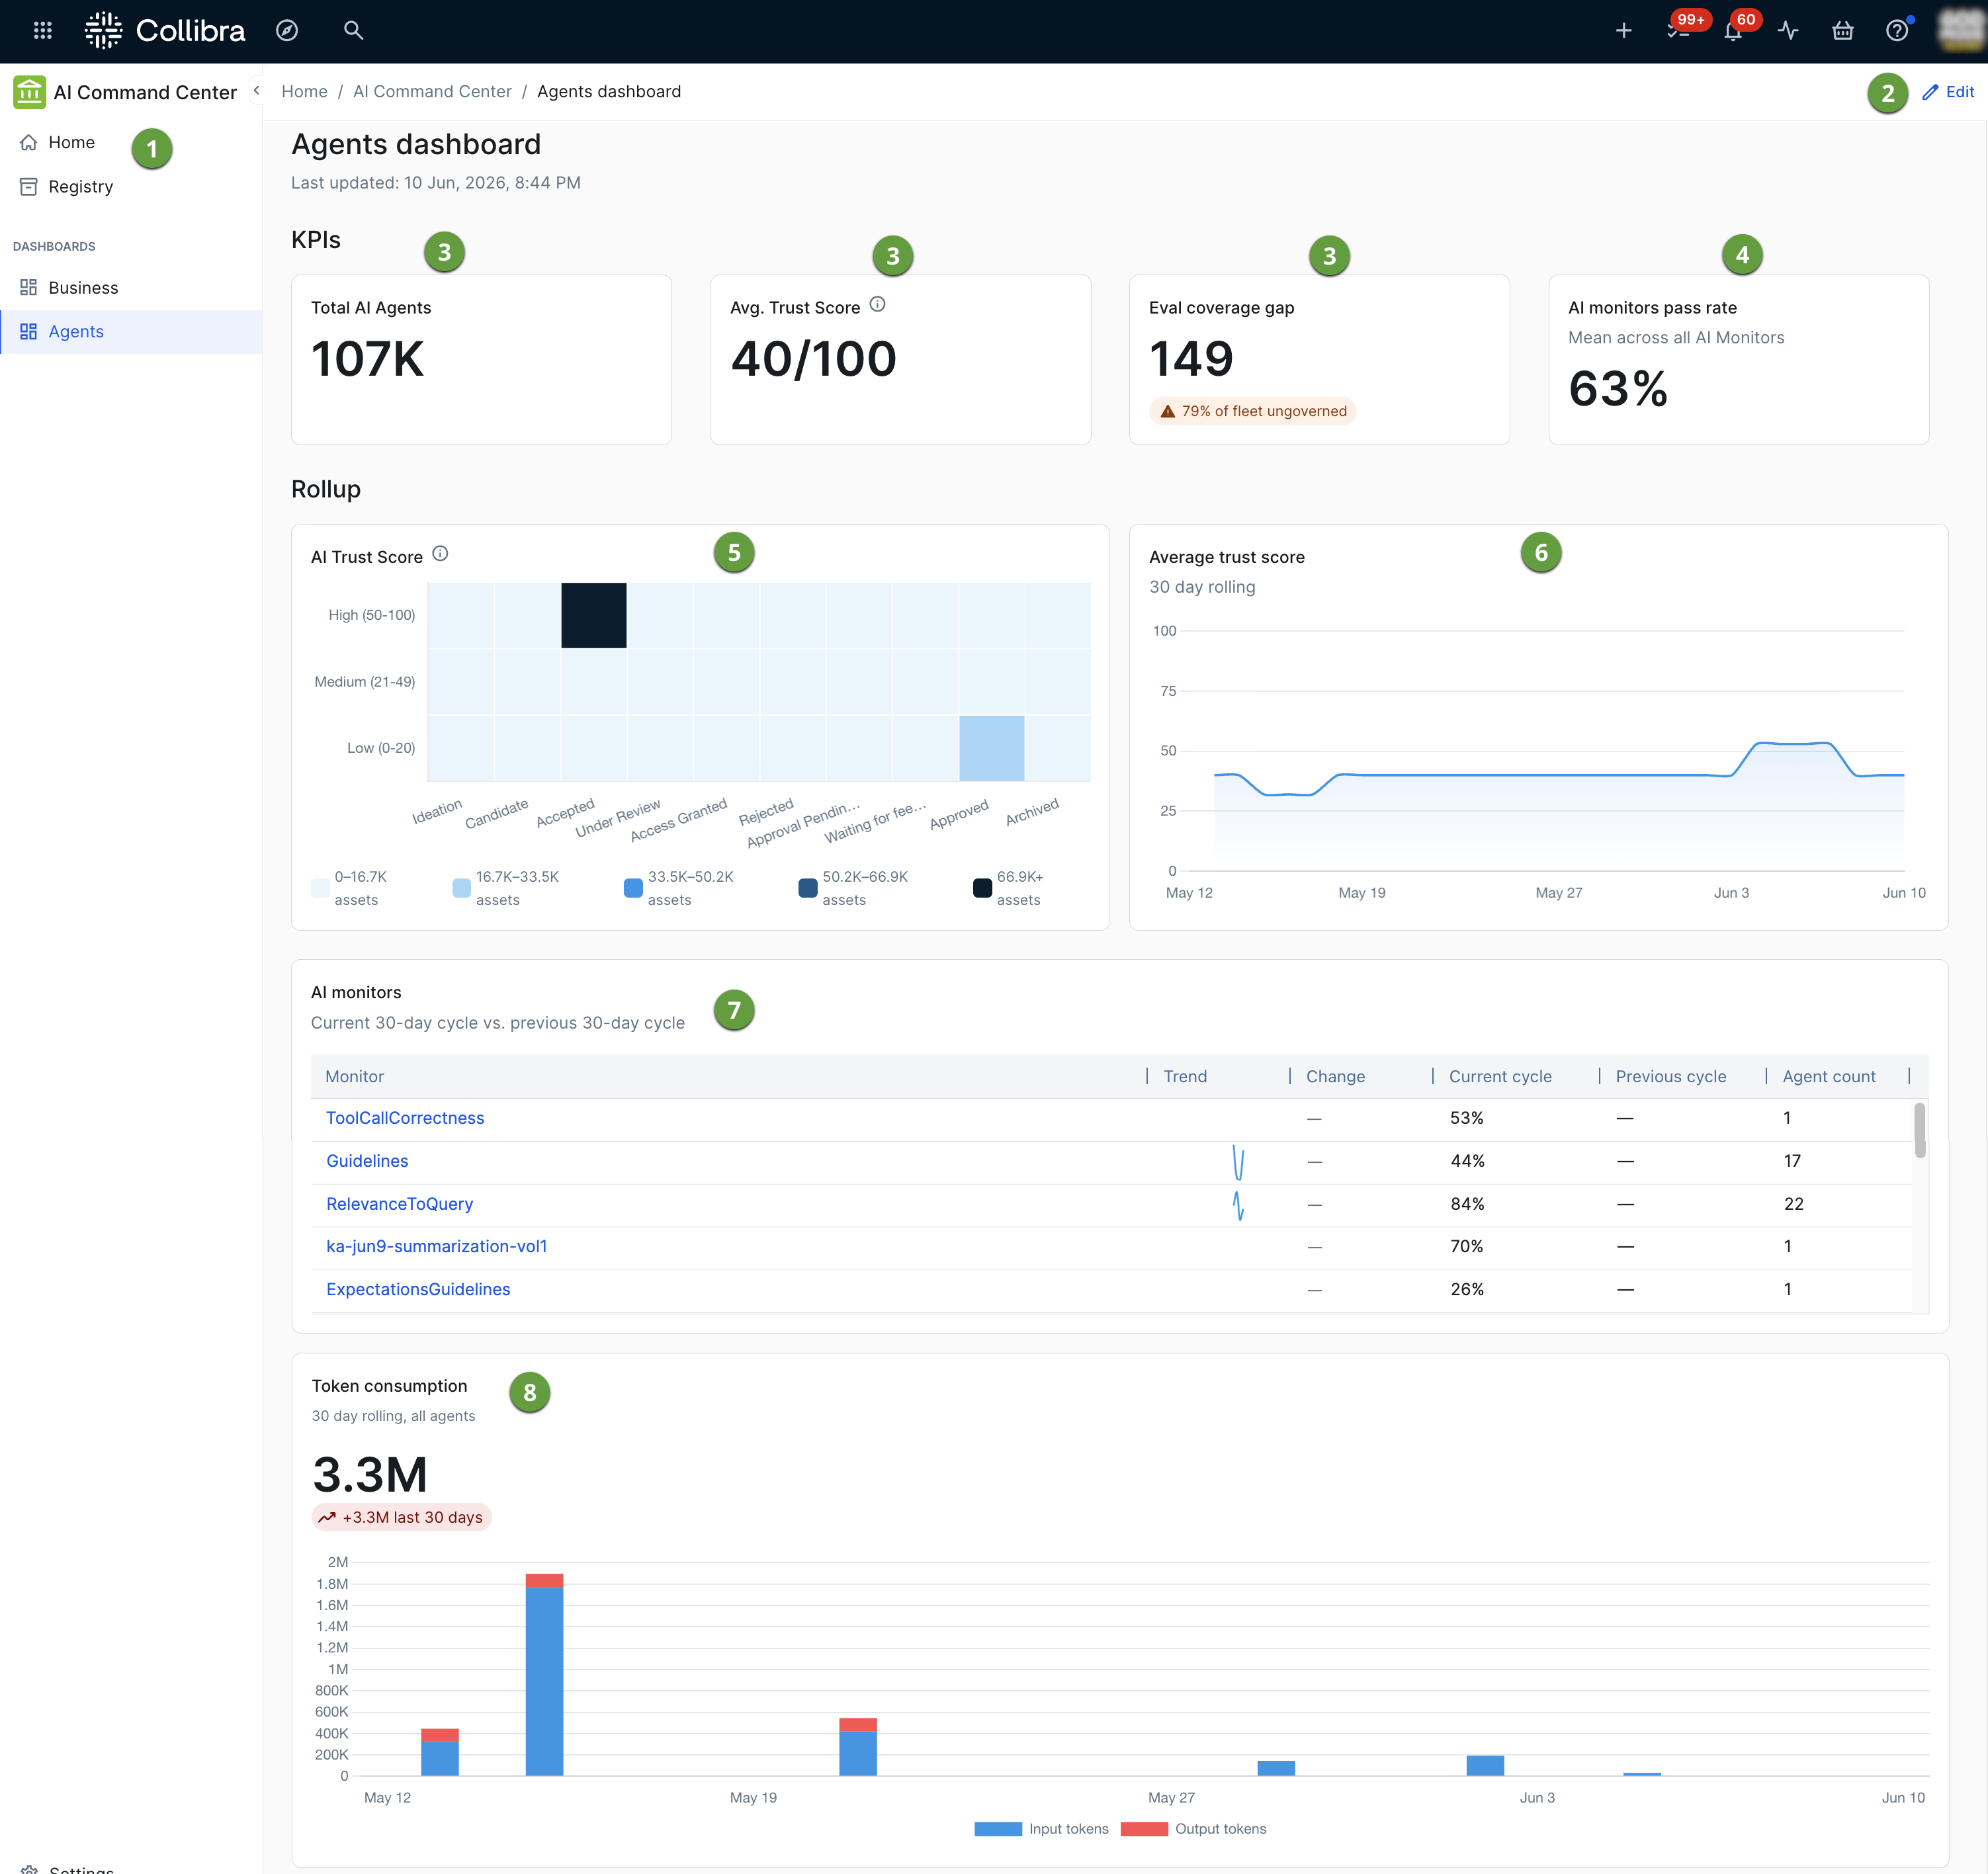
AI Command Center Agents dashboard

The Agents dashboard provides a fleet-wide overview of operational signals relevant to your governance efforts for AI agents. Unlike the Business dashboard, which focuses on governance health across your AI portfolio, the Agents dashboard surfaces operational signals from Databricks as context for your governance process.

For background on how the signals in this dashboard are collected, go to Operational trust for AI agents.

Note The metrics on this dashboard reflect the assets you have permission to view. Users with different view permissions may see different numbers.

Prerequisites

To view the Agents dashboard:

As an administrator, you can configure the dashboard to suit your needs. For complete information, go to Page Editor.

Default dashboard configuration

The following image shows the default Agents dashboard configuration.

No. Component Description

number one

Sidebar navigation Tabs to access the AI Command Center landing page, registry, and dashboards. Under Dashboards, you can switch between the Business and Agents dashboards.

number two

Edit button

Allows administrators to configure the dashboard. For complete information, go to:

number three

Metric KPI widgets

Three configurable KPI tiles, all included by default:

  • Total AI Agents: The total number of AI Agent assets in your Collibra environment.
  • Avg. Trust Score: The average AI Trust Score across all AI Agent assets.
  • Eval coverage gap: The number of AI Agent assets with no LLM judge assigned. Agents in the coverage gap are not being evaluated for quality and contribute no data to operational trust signals.

An administrator can also manually add the Total CO2 emissions KPI tile.

number four

AI monitors pass rate The mean pass rate across all AI Monitor assets (LLM judges) in your environment, expressed as a percentage. This figure represents the average quality signal at a fleet level. Click Mean across all AI Monitors to scroll to the AI monitors table.

Number five

AI Trust Score distribution A heatmap in the Rollup section that shows the distribution of AI Agent assets by Trust Score tier (High, Medium, Low) and lifecycle stage. Color intensity indicates asset count density — darker cells represent more assets. Use this view to identify which lifecycle stages contain the most agents with low Trust Scores.

number six

Average trust score A 30-day rolling line chart in the Rollup section showing the mean AI Trust Score over time across all AI Agent assets. Use this view to track whether overall agent quality is improving or declining.

number seven

AI monitors

A table comparing each LLM judge's (AI Monitor's) pass rate in the current 30-day cycle against the previous cycle. The table shows:

  • Monitor: The name of the AI Monitor (LLM judge). Click the row to open a panel listing the AI Agent Versions evaluated by that monitor, showing each version's owner, current 30-day cycle pass rate, and cycle-over-cycle change, sorted with the lowest pass rates first. Click an agent version in the panel to navigate to its asset page.
  • Trend: A sparkline showing the pass rate trend over time.
  • Change: The percentage point change in pass rate between the current and previous cycles.
  • Current cycle: The pass rate for the current 30-day period.
  • Previous cycle: The pass rate for the preceding 30-day period.
  • Agent count: The number of AI Agent Version assets evaluated by this monitor.

For information on how pass rates are calculated, go to AI monitoring for AI agents.

number eight

Token consumption A 30-day rolling bar chart showing daily prompt (input) and completion (output) token counts across all agents. The total token count for the period is shown above the chart. Use this view to monitor resource consumption trends and identify spikes that may indicate unexpected agent behavior.

Drill-down exploration

Like the Business dashboard, this dashboard supports interactive exploration. When you hover your cursor over a colored section in a chart, such as a cell in the AI Trust Score distribution heatmap, a tooltip appears, providing a precise breakdown for that segment.

Beyond just viewing the numbers, these chart elements function as active links for deeper investigation. When you click a chart segment, a side panel opens showing a filtered view of the AI Agent assets that make up the clicked data point, including each asset's owner and trust score. On a wide enough screen, the panel appears alongside the dashboard; on a narrower screen, it opens as an overlay instead.