Working with the Job Management page
You can use the centralized lists to:
- Find jobs with low quality scores or unsuccessful runs across all your connections.
- Review monitor results without opening individual job pages.
- Run, cancel, or delete multiple jobs in a single action.
- Export one or more jobs to promote them to another environment (in preview).
- Suppress, edit, or delete multiple monitors at once.
Overview of the Job Management tabs
The Job Management page uses two tabs (Jobs and Monitors) to organize jobs, monitors, and available actions.
The following image and sections describe the key functional areas of the Jobs tab.
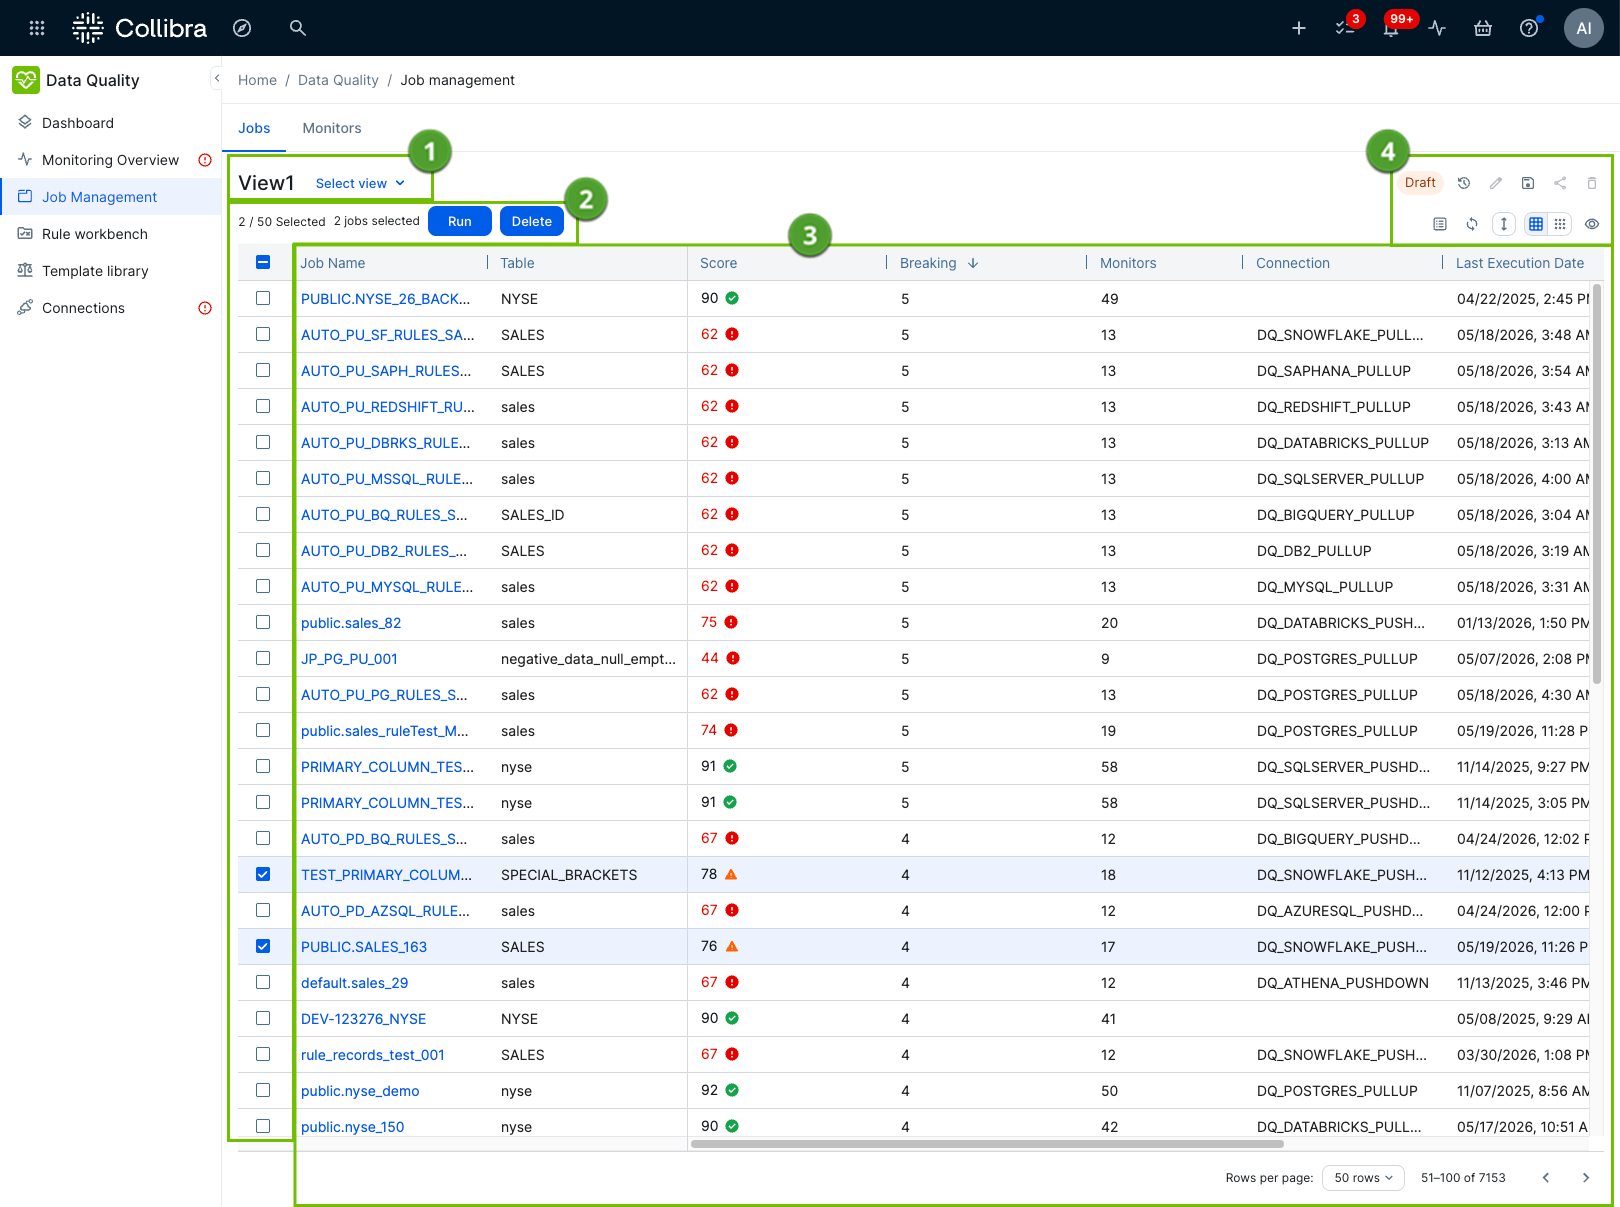
List view name and selector
The list view name and selector section ( ) shows the name of the current view. Click Select view to open a different view.
Job filters and actions
The job filters and actions section ( ) allows you to filter the jobs that show and perform actions on selected jobs at once.
Click the  icon to quickly find the data you need by limiting the number of assets shown in a table or a set of tiles. See the Filters page for more information.
Note You cannot combine computed metric filters (Breaking %, Passing %, # Runs, Breaking Count, Passing Count, % Change, Tolerance) with non-metric filters using OR. Use AND instead.
Each row has a checkbox, and you can select or deselect all items on the current page by clicking the checkbox in the header. Selection does not extend across pages, but you can control the number of rows per page by selecting an option from the Rows per page drop-down list at the bottom of the page.
When you select one or more jobs, you can:
- Run: Add the selected jobs to the run queue immediately. A notification confirms the number of jobs added.
- Delete: Permanently remove the selected jobs. A confirmation popup lists the jobs before deletion proceeds.
- Export (in preview): Download the selected jobs as a JSON file so you can import them into another environment. The Export button appears only when you select one or more jobs. You can export any job you have permission to view.
Note For exports with many jobs, exporting can take longer to prepare. If any jobs fail to export, a table lists the failed jobs and the reason for each failure. Click Try again to retry the export without reopening the dialog.
Job actions respect your existing permissions. If your selection includes items you do not have permission to act on, the system notifies you before proceeding.
Jobs list
The jobs list ( ) shows every data quality job you have permission to see, regardless of which connection it belongs to.
You can sort and apply filters by any column header. Each page shows up to 100 jobs.
Clicking a job name opens the most recent run on the Profile tab of the Job Details page.
Jobs list layout editor
The jobs list layout options section ( ) allows you to:
-
 : Edit the view name and description.
 -
 : Save changes to your view or create a copy of it.
 -
 : Share or restrict access to your view, pin it to the view selector, and set it as the default view.
 -
 : Delete your view.
 -
 : Edit the fields in your view.
 -
 : Refresh your view to pull in the latest data.
 -
 : Wrap or trim text in cells.
 -
 /
/ : Display the view as a list or tiles.
 -
 : Preview the job details, including Created By, Table, Connection, Status, Scheduled, and total and breaking monitors.
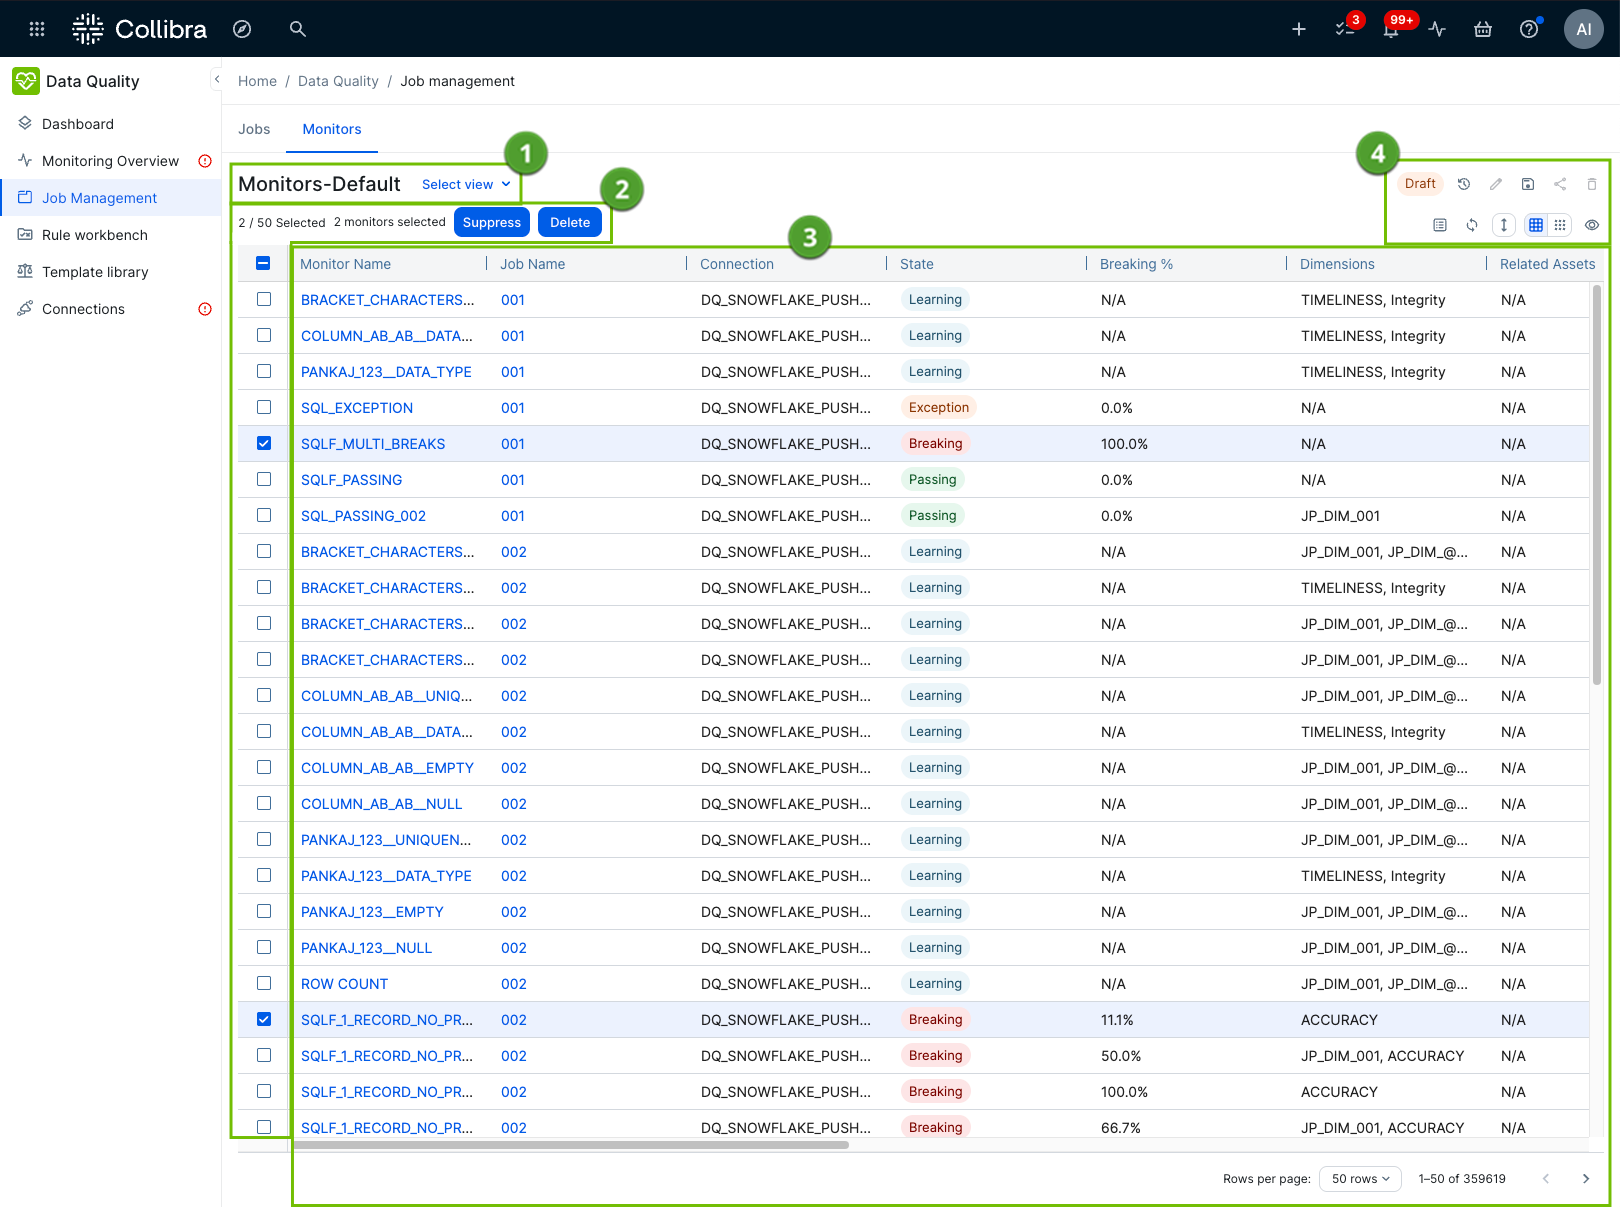
The following image and sections describe the key functional areas of the Monitors tab.
List view name and selector
The list view name and selector section () shows the name of the current view. Click Select view to open a different view.
Monitor filters and actions
The monitor actions section () allows you to filter the monitors that show and perform actions on selected monitors at once.
Click the icon to quickly find the data you need by limiting the number of assets shown in a table or a set of tiles. See the Filters page for more information.
- You cannot use Dimensions and Monitor Type filters with
ORin a formula. UseANDinstead. - The Dimensions and Monitor Type filters only support the Equals (
IN) and Does Not Equal (NOT_IN) operators. - You cannot combine computed metric filters (Breaking %, Passing %, # Runs, Breaking Count, Passing Count, % Change, Tolerance) with non-metric filters using
OR. UseANDinstead.
Each row has a checkbox, and you can select or deselect all items on the current page by clicking the checkbox in the header. Selection does not extend across pages, but you can control the number of rows per page by selecting an option from the Rows per page drop-down list at the bottom of the page.
When you select one or more monitors, you can:
- Suppress: Pause the selected monitors so they do not report results.
- Assign dimension: Assign one or more dimensions to multiple Rule monitors at once. Dimension assignment overwrites any previously assigned dimensions. The option is disabled when your selection includes one or more Adaptive monitors.
- Tolerance (Rule): Set a rule tolerance value for multiple Rule monitors at once. The value must be an integer between 0 and 100. The option is enabled only when all selected monitors are of the Rule type.
- Tolerance (Adaptive): Set the adaptive tolerance tier (strict, neutral, lenient) for multiple Adaptive monitors at once. The option is enabled only when all selected monitors are of the Adaptive type.
- Delete: Permanently remove the selected monitors. A confirmation popup lists the monitors before deletion proceeds.
Monitor actions respect your existing permissions. If your selection includes items you do not have permission to act on, the system notifies you before proceeding.
Monitors list
The monitors list () shows every monitor you have permission to see across all jobs and connections.
You can sort and apply filters by any column header.
Clicking a custom rule monitor opens the Rule Workbench for that rule. Clicking an adaptive rule monitor opens the most recent run on the Monitors tab of the Job Details page.
Monitors list layout options
The monitors list layout options section () allows you to:
-
: Edit the view name and description.
-
: Save changes to your view or create a copy of it.
-
: Share or restrict access to your view, pin it to the view selector, and set it as the default view.
-
: Delete your view.
-
: Edit the fields in your view.
-
: Refresh your view to pull in the latest data.
-
: Wrap or trim text in cells.
-
/: Display the view as a list or tiles.
-
: Preview the monitor details, including Job Name, Connection, Monitor Type, Dimensions, State, and Table.
- Switch views.
- Review the monitoring coverage of your data sources.
- Add quick monitoring.
- Create a job.
- Evaluate the data profile.
- Analyze data quality monitors.