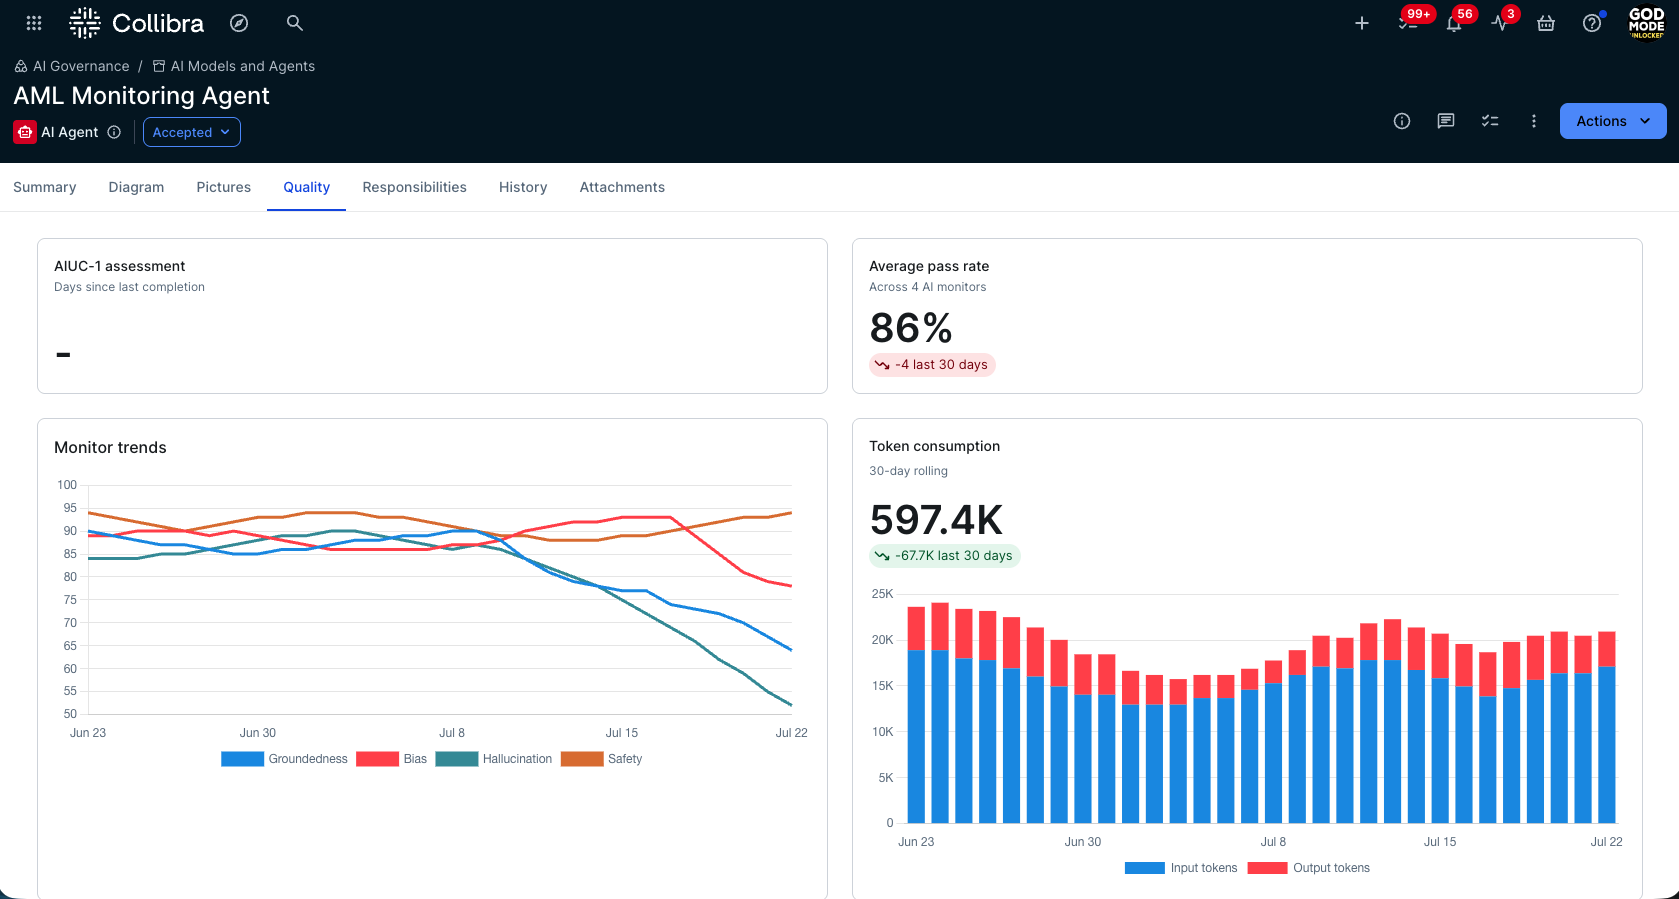
The Quality tab on AI Agent and AI Agent Version asset pages shows quality signals for agents integrated via a supported AI integration. It combines governance assessment status with live operational trust metrics, monitor pass rates and token consumption, giving you a complete picture of how the agent is performing in production. For the current list of supported AI integrations, go to Operational trust for AI agents.
For a fleet-wide view across all agents and monitors, go to the Agents dashboard.
Note Operational trust data on this tab requires the AI platform to have monitoring data available for the agent, for example, agent interaction trace data in Databricks, or CloudWatch invocation metrics in AWS Bedrock. If this data is not available, the Average pass rate, Monitor trends, and Token consumption sections show no data. The AIUC-1 assessment card is independent of this.
Quality tab components
| Component | Description |
|---|---|
| AIUC-1 assessment | Shows the number of days since the last AIUC-1 assessment was completed for this asset. A dash indicates no assessment has been completed. |
| Average pass rate | The mean monitor pass rate across all AI Monitor assets linked to this agent, expressed as a percentage. The number of AI monitors contributing to the average is shown below the label. A positive or negative trend value indicates the change in pass rate over the last 30 days. For details on how the pass rate is calculated, go to AI monitoring for AI agents. |
| Monitor trends | A multi-series line chart showing the daily pass rate for each AI Monitor linked to this agent. Each monitor is represented by a distinct colored line, with a color-coded legend below the chart. Hover over any point on the chart to see a tooltip with the exact pass rate per monitor for that date. Use this chart to identify which monitors are declining or showing inconsistent results over time. |
| Token consumption | A stacked bar chart showing prompt (input tokens) and completion (output tokens) token counts over the last 30 days for this agent. Use this chart to monitor resource consumption trends and identify spikes that may indicate unexpected agent behavior. If no monitoring data is available, this section shows no data. |