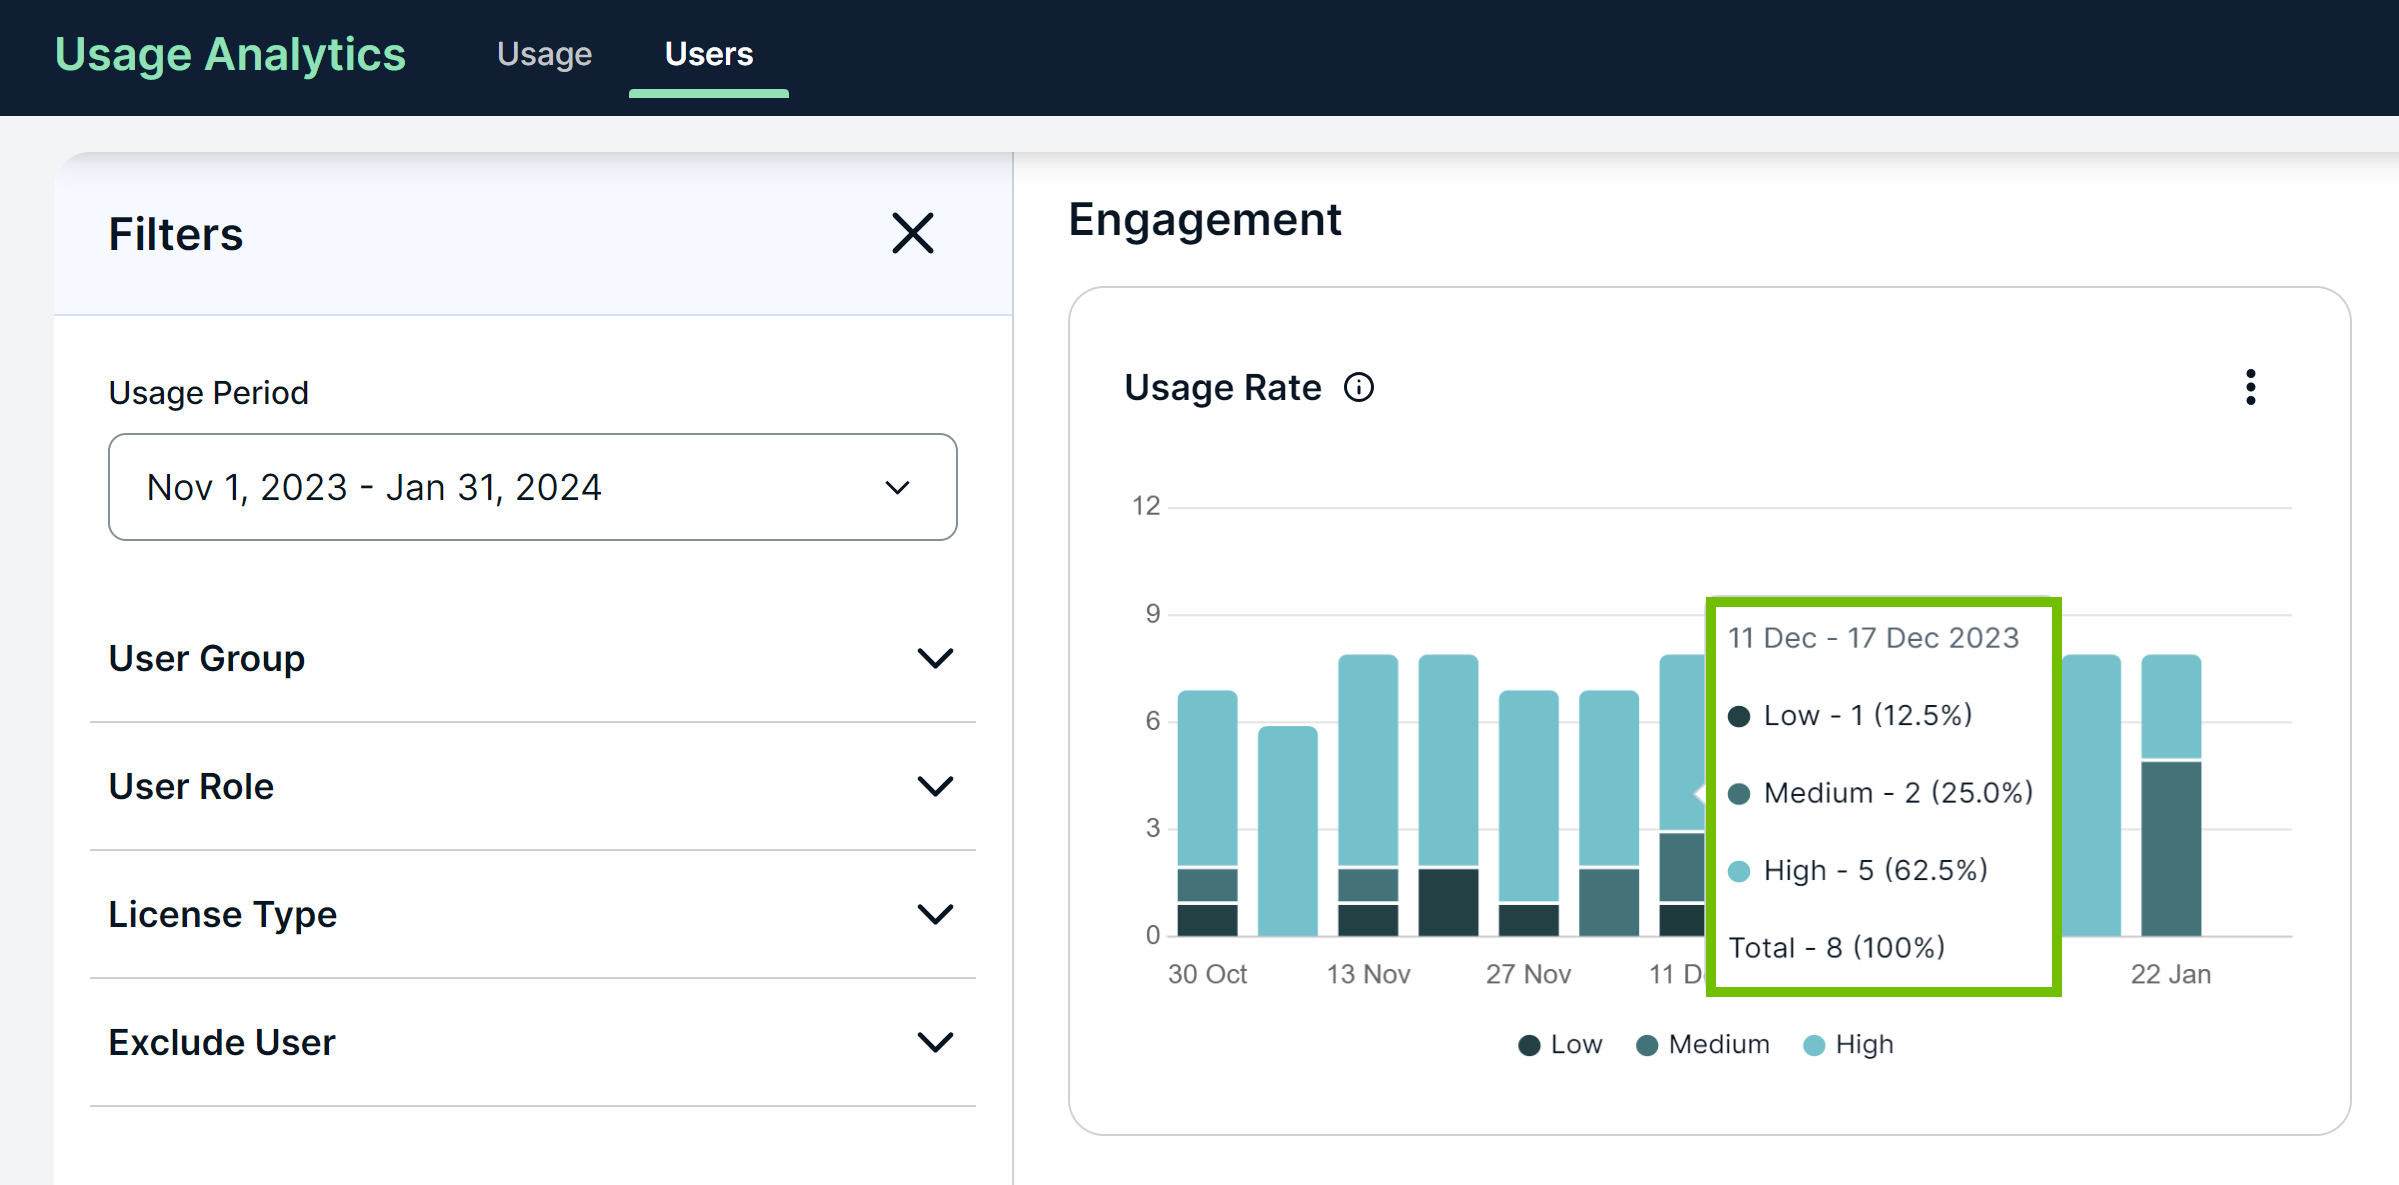
Note This topic is specific to the Usage Analytics dashboard that is available only in the latest UI.
In the
The
- Low: Number of users who signed in for less than 30% of the days within an interval.
- Medium: Number of users who signed in for between 30% and 50% (inclusive) of the days within an interval.
- High: Number of users who signed in for more than 50% of the days within an interval.
The usage rate for each category is determined by counting the number of users falling into each category within an interval, and expressing it as a percentage of the total number of users within that interval. This provides insights into user engagement levels based on their sign-in frequency within a specific interval.
Example
To understand the data shown in the

- 30% of 7 days = 2.1 days (rounded to 2 days when calculating the metrics)
- 50% of 7 days = 3.5 days (rounded to 3 days when calculating the metrics)
How to read and interpret the data
According to the highlighted data point in the chart:
- 11 Dec - 17 Dec 2023: The interval for which the data is shown is Dec 11-17, 2023, which constitutes 7 days.
- Total - 8 (100%): A total of 8 users signed in during the current interval.
- Low - 1 (12.5%): 1 out of the 8 users signed in for less than 30% of the 7 days, that is, less than 2 days. This constitutes 12.5% of users.
- Medium - 2 (25.0%): 2 out of the 8 users signed in for between 30% and 50% (inclusive) of the 7 days, that is, between 2 and 3 days (inclusive). This constitutes 25% of users.
- High - 5 (62.5%): 5 out of the 8 users signed in for more than 50% of the 7 days, that is, more than 3 days. This constitutes 62.5% of users.
Tip You can view the chart in full screen or as a table, and also download the chart as an image or a CSV file using ![]() .
.