Admins can use the Data Quality Jobs page to monitor job consumption and avoid service interruptions caused by exceeding the allowance. Located in the Users and subscriptions section of Settings, this page provides an overview of the entitled data quality jobs and current usage.
Understanding the data quality jobs allowance
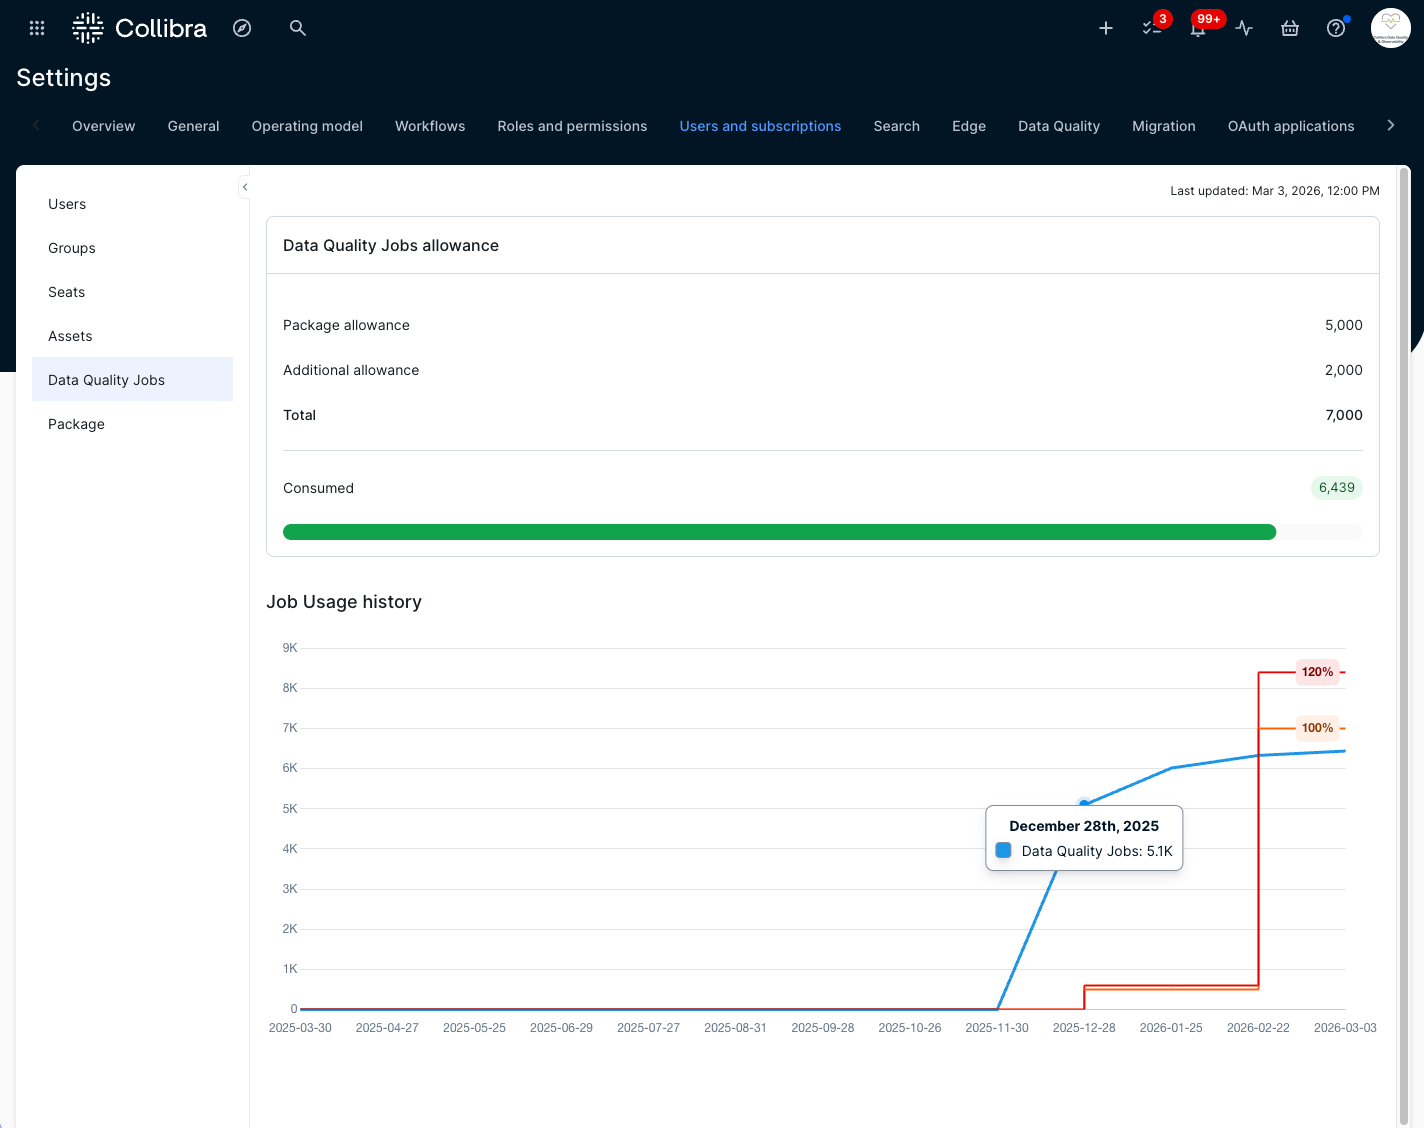
The Data Quality Jobs allowance section shows a breakdown of the number of jobs consumed against your total allowance.
The total allowance is determined by combining:
- Package allowance: The number of data quality jobs included in your package.
- Additional allowance: Any extra data quality job bundles that you have purchased.
As your organization reaches the maximum number of allocated data quality jobs, you can purchase additional job bundles to increase your allowance. The number of allocated data quality jobs has a 20% buffer to help you manage consumption after exceeding the entitled amount.
When the total number of data quality jobs goes over 120% for more than 10 consecutive weeks, you can no longer:
- Manually run new data quality jobs.
- Schedule new data quality jobs to run.
- Trigger new data quality jobs from external systems.
If you exceed the critical job limit and your 10-week resolution period ends, a message appears indicating that job creation is unavailable. You will see this message when you attempt to create a job in the Monitoring Overview page, including via the quick monitoring options and the + Data Quality Job button.
Important Deleting an Edge site does not delete jobs associated with connections on the deleted Edge site. Though orphaned, those jobs continue to count against the job quota and are not visible in the Monitoring Overview.
Visualizing historical job usage
The Job Usage history section shows a graph depicting the job consumption over time.
The x-axis shows data points for the last 12 months, ending on the last Sunday of each month. It also shows your usage status as of today.
The y-axis represents job usage in increments of 1,000.
Hover your cursor over the blue line to see the total number of jobs consumed on a specific date. The value is rounded to the nearest hundredth. The orange line represents 100% of the total allowance as of a given date. The red line represents 120% of the total allowance as of a given date. For example, in the screenshot above, the total allowance is 7,000, which means that 120% of 7,000 is 8,500.
Example: Monitoring jobs allowance
Suppose your organization has a Premier license (500 jobs) and you purchase an additional 50 jobs. This gives you a total allowance of 550 jobs. Currently, you have consumed 450 jobs.
If your team creates 175 new jobs for a quarterly compliance initiative, your total consumption reaches 625 jobs. This exceeds your total allowance of 550 jobs but remains within the critical limit of 660 jobs (120% of total jobs purchased). You receive a warning banner in Settings, alerting you to monitor job usage closely.
Summary of calculation:
- Total allowance: 500 (Premier license) + 50 (Purchased) = 550 jobs
- Consumption: 450 (Existing jobs) + 175 (New jobs) = 625 jobs
- Critical limit: 550 (Total allowance) x 1.20 (120%) = 660 jobs
- Result: 625 is greater than 550 (Warning) but less than 660 (Critical limit)
If the consumption exceeds 660 jobs, the system prevents you from creating additional jobs after a 10-week grace period. This protection ensures the organization maintains service continuity while providing time to either purchase additional job allowances or optimize its existing job portfolio.
With a tight deadline for the team to meet the requirements of the compliance initiative, you can contact Collibra to purchase more jobs to increase your total allowance.