Important This topic is applicable only to the classic UI. For a similar feature in the latest UI, go to Usage Analytics.
The Metrics pages contain a variety of statistics related to how an application is used. The pages contain one or more graphs, their legends, and some counters. For each graph, you can edit the data set and the time range shown.
Metrics page
Note On the Metrics page, the lines that are shown on a given graph are called data sets. Do not confuse these with Catalog Data Sets page in the true context of Collibra Data Catalog. On this page, when you click Add data set, it simply means that you want to add another line to the graph.

| Number | Element | Description |
|---|---|---|
|
1 |
Color-coded bars |
A quick overview of the graph. The vertical line leading from the color-coded bar indicates the difference between the minimum and maximum values. |
|
2 |
Data set details |
More details about the graph. Hover your pointer over the color-coded bars to the left of each line of graph to view them. |
|
Number of elements
|
The amount of days in the time range. |
|
|
Minimum
|
The lowest count on any day in the data set. |
|
|
Q1
|
The first quartile, meaning the lowest 25% of the data set. |
|
|
Median
|
The median, meaning the middle value of the data set. |
|
|
Q3
|
The third quartile, meaning the lowest 75% of the data set. |
|
|
Maximum
|
The highest count on any day in the time range. |
|
|
3 |
Graph |
The actual graph. What it shows depends on the data set. For example, it can show the number of assets viewed over the last month, or the number of licenses used. Tip You can edit the time range of the graph. |
|
4 |
Counts by day |
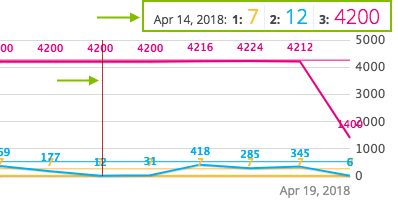
Hover your pointer over the graph to see the counts for a specific day for each data set. The vertical red line identifies the day. The exact count for that day for each data set is shown above the graph.
|
|
5 |
Legend |
The legend of the graph, which also allows you to add, edit, and delete the data sets. |
Add a data set to a metrics graph
You can add a data set to a graph on the Metrics, for example, if you want to compare the amount of new assets of different types.
Prerequisites
Your environment uses the classic UI.
Steps
- Open the product for which you want to see the metrics, for example, Business Glossary.
- On the submenu, click Metrics.
The Metrics page opens. - Under the relevant graph, to the right, click Add data set.
The filter settings is shown. - Enter the required information.
Filter setting Description Filter Type
The type of data that will be counted.
Depending on the filter type you select, different fields become available.
Active UsersA daily count of the active users to have viewed the relevant assets.
You can restrict the count results via the following additional filters:
- License: Limit the results to active users with a specific license type.
- Community: Limit the results to a specific community.
- Count Operation: Select the operation by which the results are shown in the template. For example, the sum of all values, the highest value, or the lowest value each day over the last month.
- Product: Limit the results to active users within a specific Collibra Platform application.
- Role: Limit the results to active users that have been assigned a specific role.
Asset CountA daily count of the relevant assets (either data or technology assets) that have been viewed.
You can restrict the count results via the following additional filters:
- Type: Limit the results to a specific type.
- Domain: Limit the results to assets from a specific domain.
- Count Operation: Select the operation by which the results are shown in the template. For example, the sum of all values, the highest value, or the lowest value each day over the last month.
- Status: Limit the results to assets with a specific status.
- Community: Limit the results to a specific community.
Changed Task CountA daily count of workflow tasks that have been changed.
You can restrict the count results via the following additional filters:
- Workflow: Limit the results to a task in a specific workflow.
- Task Type: Limit the results to tasks of a specific type.
- Task: Limit the results to a specific task.
- Count Operation: Select the operation by which the results are shown in the template. For example, the sum of all values, the highest value, or the lowest value each day over the last month.
- Community: Limit the results to a specific community.
- Task Status: Limit the results to tasks that have a specific status (Completed, Deleted, or Unfinished).
- User: Limit the results to a specific user.
Domain CountA daily count of the domains with relevant assets (either data or technology assets) that have been viewed.
You can restrict the count results via the following additional filters:
- Type: Limit the results to a specific type.
- Count Operation: Select the operation by which the results are shown in the template. For example, the sum of all values, the highest value, or the lowest value each day over the last month.
- Community: Limit the results to a specific community.
License AvailableA daily count of Collibra licenses that have been available to users.
This is calculated by subtracting the licenses in use from the total licenses your organization has.
You can restrict the count results via the following additional filters:
- License: Limit the results to a specific type.
- Count Operation: Select the operation by which the results are shown in the template. For example, the sum of all values, the highest value, or the lowest value each day over the last month.
License UsageA daily count of Collibra licenses in use by all users in your organization.
You can restrict the count results via the following additional filters:
- License: Limit the results to active users with a specific license type.
- Count Operation: Select the operation by which the results are shown in the template. For example, the sum of all values, the highest value, or the lowest value each day over the last month.
Page HitsA daily count of Collibra asset page hits.
You can restrict the count results via the following additional filters:
- Community: Limit the results to a specific community.
- Count Operation: Select the operation by which the results are shown in the template. For example, the sum of all values, the highest value, or the lowest value each day over the last month.
- Domain: Limit the results to assets from a specific domain.
Task CountA daily count of workflow tasks carried out.
- Workflow: Limit the results to a task in a specific workflow.
- Task Type: Limit the results to tasks of a specific type.
- Task: Limit the results to a specific task.
- Count Operation: Select the operation by which the results are shown in the template. For example, the sum of all values, the highest value, or the lowest value each day over the last month.
- Community: Limit the results to a specific community.
- Task Status: Limit the results to tasks that have a specific status (Completed, Deleted, or Unfinished).
- User: Limit the results to a specific user.
Task DurationA daily count of workflow task duration.
You can restrict the count results via the following additional filters:
- Workflow: Limit the results to a task in a specific workflow.
- Task Type: Limit the results to tasks of a specific type.
- User: Limit the results to a specific user.
- Count Operation: Select the operation by which the results are shown in the template. For example, the sum of all values, the highest value, or the lowest value each day over the last month.
- Community: Limit the results to a specific community.
- Task: Limit the results to a specific task.
- Click Save data set.
Edit a data set of a metrics graph
You can edit the data set that is shown in a graph on the Metrics.
Prerequisites
Your environment uses the classic UI.
Steps
- Open the product for which you want to create an asset, for example, Business Glossary.
- On the submenu, click Metrics.
The Metrics page opens. - In the legend under the relevant graph, click the data set you want to edit.

The filter configuration for the data set appears. - Enter the required information.
Filter setting Description Filter Type
The type of data that will be counted.
Depending on the filter type you select, different fields become available.
Active UsersA daily count of the active users to have viewed the relevant assets.
You can restrict the count results via the following additional filters:
- License: Limit the results to active users with a specific license type.
- Community: Limit the results to a specific community.
- Count Operation: Select the operation by which the results are shown in the template. For example, the sum of all values, the highest value, or the lowest value each day over the last month.
- Product: Limit the results to active users within a specific Collibra Platform application.
- Role: Limit the results to active users that have been assigned a specific role.
Asset CountA daily count of the relevant assets (either data or technology assets) that have been viewed.
You can restrict the count results via the following additional filters:
- Type: Limit the results to a specific type.
- Domain: Limit the results to assets from a specific domain.
- Count Operation: Select the operation by which the results are shown in the template. For example, the sum of all values, the highest value, or the lowest value each day over the last month.
- Status: Limit the results to assets with a specific status.
- Community: Limit the results to a specific community.
Changed Task CountA daily count of workflow tasks that have been changed.
You can restrict the count results via the following additional filters:
- Workflow: Limit the results to a task in a specific workflow.
- Task Type: Limit the results to tasks of a specific type.
- Task: Limit the results to a specific task.
- Count Operation: Select the operation by which the results are shown in the template. For example, the sum of all values, the highest value, or the lowest value each day over the last month.
- Community: Limit the results to a specific community.
- Task Status: Limit the results to tasks that have a specific status (Completed, Deleted, or Unfinished).
- User: Limit the results to a specific user.
Domain CountA daily count of the domains with relevant assets (either data or technology assets) that have been viewed.
You can restrict the count results via the following additional filters:
- Type: Limit the results to a specific type.
- Count Operation: Select the operation by which the results are shown in the template. For example, the sum of all values, the highest value, or the lowest value each day over the last month.
- Community: Limit the results to a specific community.
License AvailableA daily count of Collibra licenses that have been available to users.
This is calculated by subtracting the licenses in use from the total licenses your organization has.
You can restrict the count results via the following additional filters:
- License: Limit the results to a specific type.
- Count Operation: Select the operation by which the results are shown in the template. For example, the sum of all values, the highest value, or the lowest value each day over the last month.
License UsageA daily count of Collibra licenses in use by all users in your organization.
You can restrict the count results via the following additional filters:
- License: Limit the results to active users with a specific license type.
- Count Operation: Select the operation by which the results are shown in the template. For example, the sum of all values, the highest value, or the lowest value each day over the last month.
Page HitsA daily count of Collibra asset page hits.
You can restrict the count results via the following additional filters:
- Community: Limit the results to a specific community.
- Count Operation: Select the operation by which the results are shown in the template. For example, the sum of all values, the highest value, or the lowest value each day over the last month.
- Domain: Limit the results to assets from a specific domain.
Task CountA daily count of workflow tasks carried out.
- Workflow: Limit the results to a task in a specific workflow.
- Task Type: Limit the results to tasks of a specific type.
- Task: Limit the results to a specific task.
- Count Operation: Select the operation by which the results are shown in the template. For example, the sum of all values, the highest value, or the lowest value each day over the last month.
- Community: Limit the results to a specific community.
- Task Status: Limit the results to tasks that have a specific status (Completed, Deleted, or Unfinished).
- User: Limit the results to a specific user.
Task DurationA daily count of workflow task duration.
You can restrict the count results via the following additional filters:
- Workflow: Limit the results to a task in a specific workflow.
- Task Type: Limit the results to tasks of a specific type.
- User: Limit the results to a specific user.
- Count Operation: Select the operation by which the results are shown in the template. For example, the sum of all values, the highest value, or the lowest value each day over the last month.
- Community: Limit the results to a specific community.
- Task: Limit the results to a specific task.
- Click Save data set.
The updated data set is shown in the graph.
Edit the time range of a metrics graph
By default, the graphs on the Metrics are shown in daily increments, over a time range of one month. However, you can edit the time range to suit your needs. There are two ways to edit the time range:
- Dragging within the graph.
- Selecting the dates for the graph.
Prerequisites
Your environment uses the classic UI.
Steps
Drag within the graph
- Open the product for which you want to create an asset, for example, Business Glossary.
- On the submenu, click Metrics.
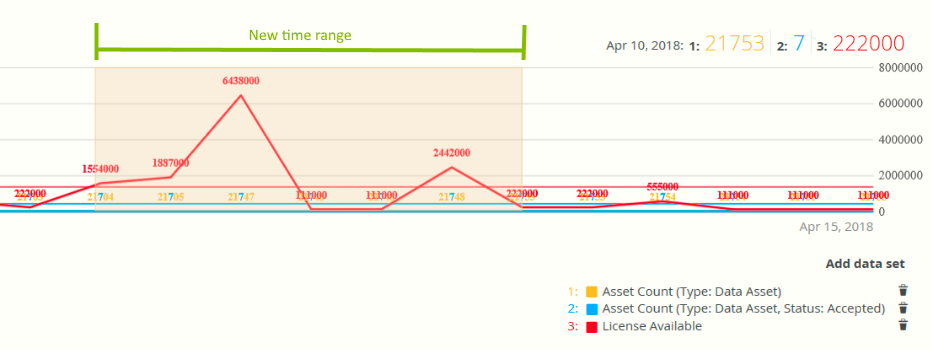
The Metrics page opens. - In the relevant graph, drag the first date in the required range to the right, towards the last date in the range.
While you are dragging, the color changes in the graph, indicating the resulting time range.
The graph is adjusted to the new time range.
Select the dates for the graph
- Open the product for which you want to create an asset, for example, Business Glossary.
- On the submenu, click Metrics.
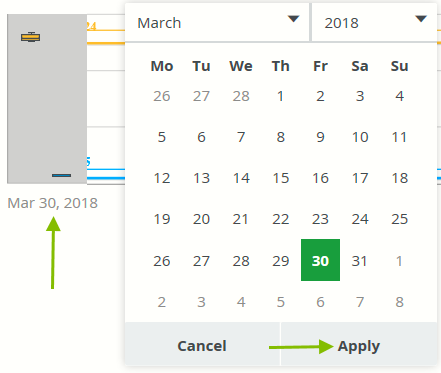
The Metrics page opens. - On the left-hand side of the graph, click the date.
A date picker appears.
- Click the first day of the required time range, and then click Apply.
The graph is adjusted to the date you selected. - On the right-hand side of the graph, click the date.
A date picker appears. - Click the last day of the required time range, and then click Apply.
The graph is adjusted to the date you selected.
Remove a data set from a metrics graph
You can remove a data set that is shown in a graph on the Metrics if, for example, there is too much information in a graph. Each graph will always show at least one data set. If it only contains one data set and you want to remove it, you need to first another data set. You can then remove the other one.
Prerequisites
Your environment uses the classic UI.
Steps
- Open the product for which you want to create an asset, for example, Business Glossary.
- On the submenu, click Metrics.
The Metrics page opens. - In the legend under the relevant graph, click
 next to the data set you want to delete.
The graph is updated.
