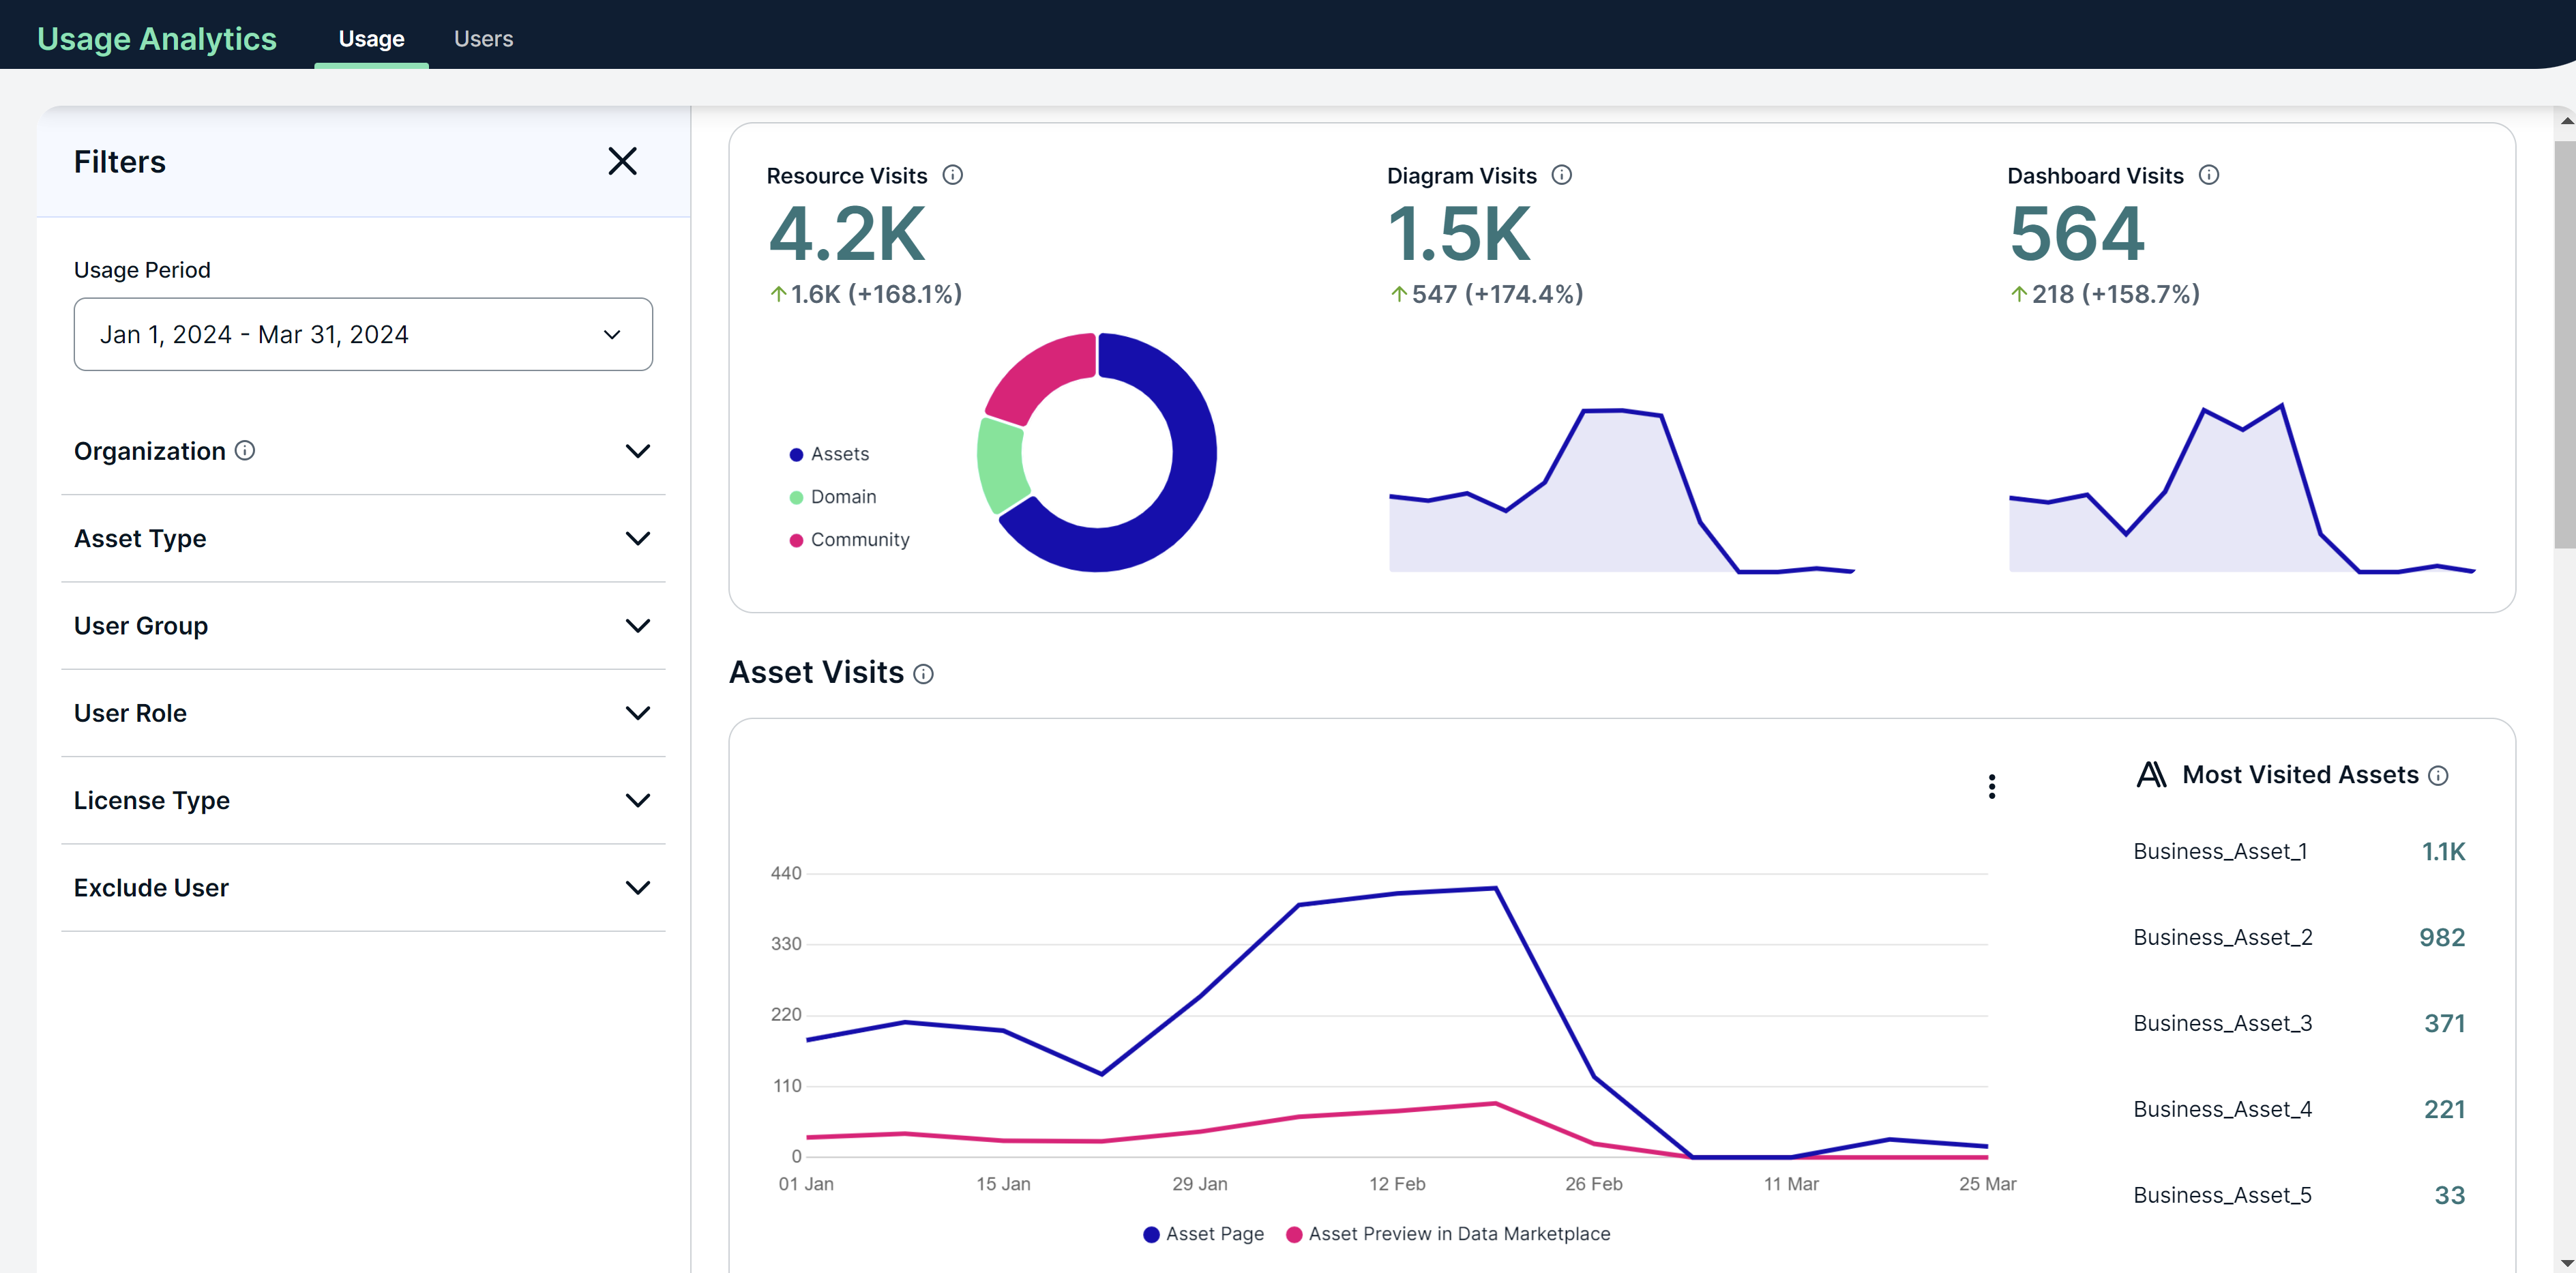
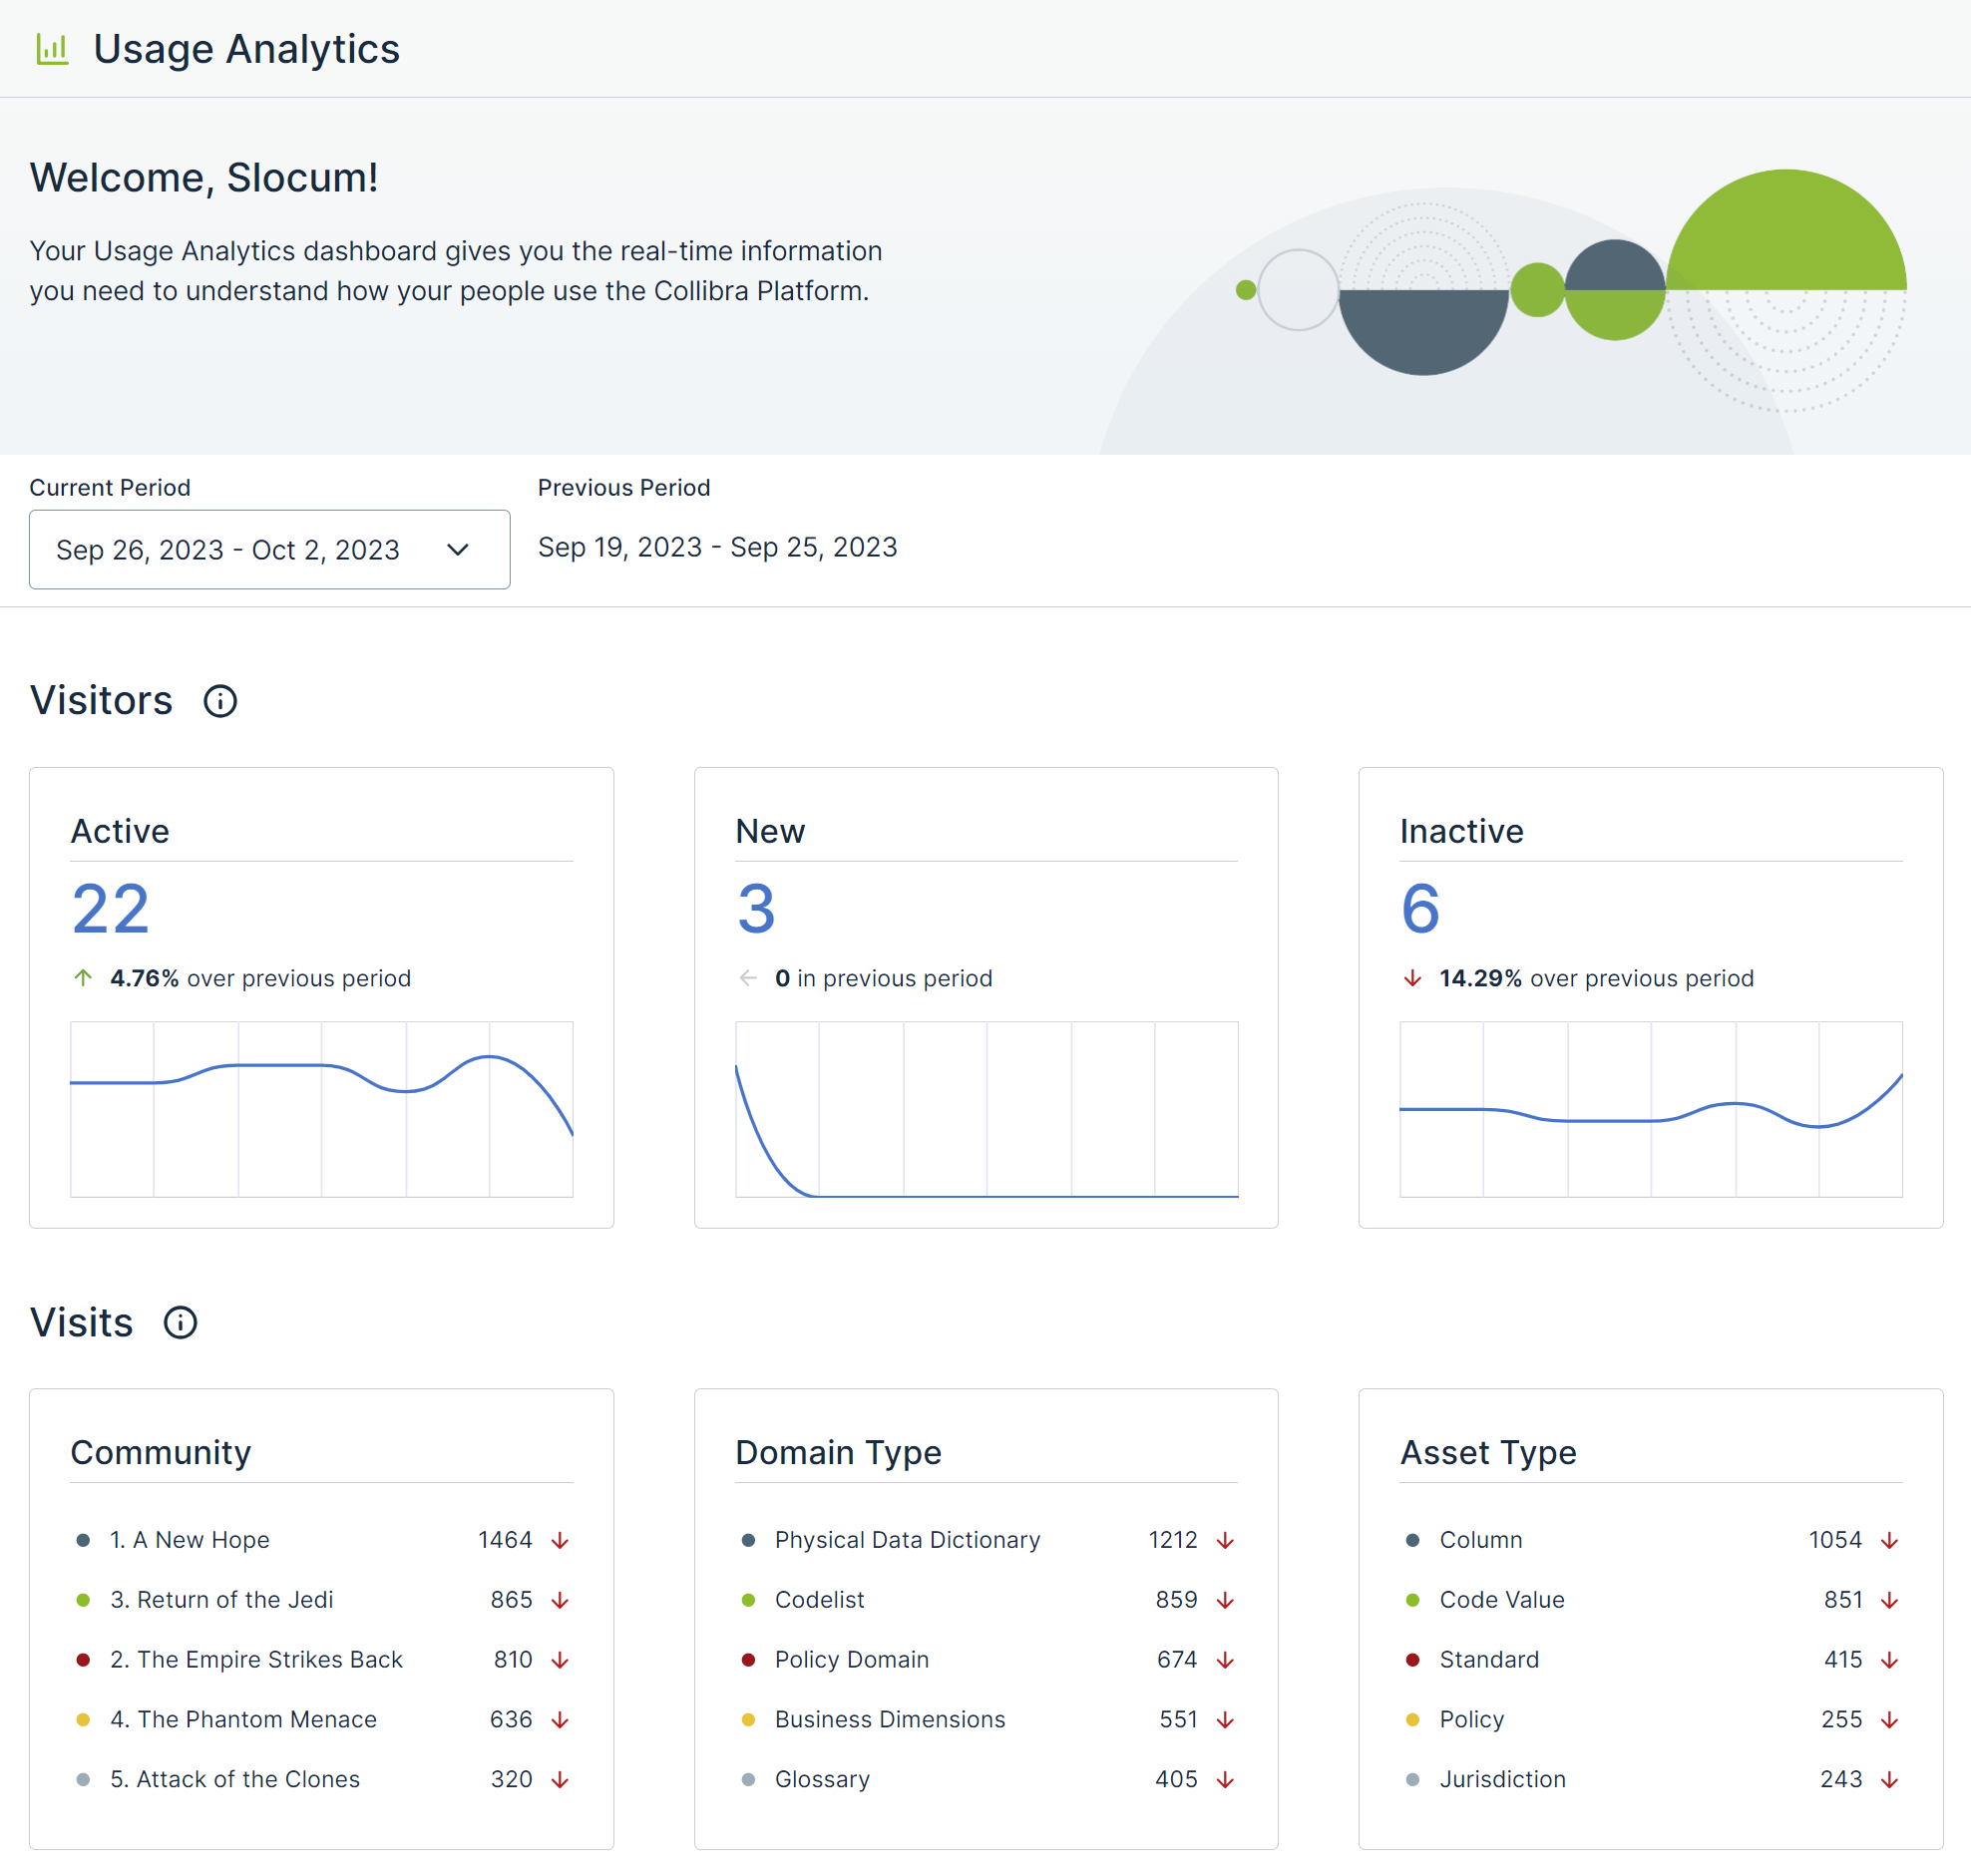
Usage Analytics is a usage-focused dashboard that provides a snapshot of who is using your Collibra environment and how they are engaging with it. It shows you the behavioral data of your users and associated analytics within Collibra.
Usage Analytics simplifies tracking the adoption of your environment by providing key metrics in near real time, with data refreshed every 2 hours. The Usage Analytics dashboard contains various sections featuring trend charts to help you gain insights into the adoption and usage of your environment. You can use the dashboard to monitor user activity, understand the total number of assets visited, and identify popular resources. Additionally, you can view the usage over time, observe trends, measure success, allocate efforts effectively, and maximize your investment. In essence, Usage Analytics can help ensure that your decisions are informed when improving the efficiency and value of your environment.
Example
Suppose that you have trained Business Stewards on how to use your Collibra environment and have run a campaign within your organization to help drive the usage of Collibra. If you want to measure the effectiveness of your campaign, you can use the Usage Analytics dashboard to check if those Business Stewards signed in to your Collibra environment during a specific period.
Personas
Some of the personas who can benefit from Usage Analytics are as follows:
- Customers who want to know who is using their Collibra environment and how they are engaging with it.
- Business Stewards who want to know if the content that they curate is useful.
- Community managers who want to know which subcommunities are active and which need more exposure.
- End users who want to see better recommendations on their content feed.
New and old Usage Analytics
Our Usage Analytics documentation is divided into the following sections:
- New Usage Analytics: Contains documentation for the Usage Analytics dashboard that is available only in the latest UI.

- Old Usage Analytics: Contains documentation for the Usage Analytics dashboard that is available only in the previous, classic UI.

Good to know
- Usage Analytics is a free, out-of-the-box product in your Collibra environment. It leverages events that are captured, stored, and processed by Collibra, in accordance with the regional requirements for customer instances. This data is made available only to customers. No third-party systems can access this data.
- Dates in Usage Analytics are stored in the Coordinated Universal Time (UTC) standard in the database but are shown in the user's local time zone in the interface. When the data is downloaded, the dates remain in UTC in the downloaded files.
- Usage Analytics doesn't collect the events that occurred before it was enabled.
- Usage Analytics was introduced in Collibra 2022.11, meaning that you can view the data on asset visits and user interactions on the Usage Analytics dashboard from November 2022. If you began using Collibra after November 2022, you can view the data starting from your onboarding date. However, data on communities, domains, dashboards, and diagrams, exclusive to the new dashboard, was added in January 2024. Therefore, this particular set of data is available from January 2024, and only in the latest UI.