The Outliers monitor detects values that differ significantly from the rest of the data and may indicate bad or incorrect data. Numerical outliers are detected with the Interquartile Range (IQR) and box plot methods.
Multiple simultaneous outlier configurations can be defined for a single dataset. However, some settings are shared between all configurations. For example, columns analyzed, key columns, and date columns are selected independently on each configuration, while categorical analysis, quartile ranges, and date look back settings are shared on all configurations for the dataset.
Note Enabling categorical outlier detection will not interfere with numerical outlier detection.
Understanding categorical outliers
Categorical outliers are values within string or categorical attributes that significantly deviate from the expected or learned normal behavior and patterns of that data. Unlike numerical outliers, which deal with quantitative values, categorical outliers focus on qualitative data. Collibra DQ is designed to automatically learn the typical behavior of these attributes, such as stock tickers or state codes. If an unusual pattern emerges—for instance, "NYC" appearing where "NY" is expected—it is flagged as a categorical outlier.
Collibra DQ employs specific techniques for identifying these anomalies, and its approach can vary based on whether a time dimension is provided:
- Without a time dimension: If no time context is supplied, Collibra DQ analyzes the distribution of categorical values within the available dataset. It then identifies values that fall into the most infrequent percentile, which is a configurable threshold, marking them as outliers.
- With a time dimension: When a date/time column is provided, the system performs a more nuanced detection. It first identifies historically infrequent categories. Then, it checks if these categories are also infrequent in the current data run. Only values that are both historically infrequent (or non-existent) and infrequent in the current run are classified as outliers. You can further refine this time-based analysis by defining specific time bins (such as minute, hour, day, month, and/or year) and processing intervals to match the granularity of your data, whether it's high-frequency or already aggregated.
For accurate categorical outlier detection, Collibra DQ leverages historical data and specific column types:
- Historical data requirement: At a minimum, Collibra DQ needs historical data to serve as a training dataset to establish a baseline for what is considered "normal".
- Key column for context: To achieve more targeted and relevant results, it's highly recommended to specify a "key" column (for example, a store_number when analyzing address values). This key column allows the system to group other columns, providing critical context and ensuring that identified outliers genuinely represent data quality issues, rather than just infrequent, but otherwise valid, values. For example, inconsistent address values tied to a unique store_number can be effectively identified as a categorical outlier.
- Lookback period: Integrating a date/time column with a lookback period enables a more precise calculation of the normal range and can help establish trends for outlier detection.
In the following example, the dataset consists of a list of all US airports with various details for each airport. In the DQ Job, the Outliers layer sets the key as AIRPORT_USE and the column of reference as AIRPORT_TYPE. The run discovered two categorical outliers in the AIRPORT_TYPE column, organized by the key, AIRPORT_USE. When AIRPORT_USE is Public, the categorical outliers are the terms Ultralightport and Balloonport, which appear three times and one time respectively. The terms Aerodome, Seaport, and Heliport are listed as the top 3 terms found in the column, indicating that they are not outliers.

Prerequisites
-
Ensure the
export outlier_calibration_enabled=trueparameter is in owl-env.sh.
Outlier findings
The following table describes the information available on the Outliers tab of the Findings page.
| Column | Description |
|---|---|
| Key | The column assigned as a Key column. Any outliers that Collibra DQ are grouped by this column if and when a Key is assigned. |
| Column | The column where a potential outlier is detected. |
| Value | The value of the column of the detected outlier. |
| Count | The number of potential outliers in the column. |
| Predicted | The type of value that Collibra DQ predicts for a given run, for example, categorical. This prediction is based on the observed values of previous runs. |
| Conf |
The confidence score, ranging from 0 to 100, indicates how far the current value is from the lower or upper bound. Lower scores such as 0 or 1, indicate a higher likelihood of the value being an outlier. Conversely, higher scores, such as 97, suggest a lower likelihood of the value being an outlier. |
| Status |
Lets you label and train a finding. a finding. The available dropdown menu options are Validate, Invalidate, and Resolve. Validate instructs Collibra DQ to either assign a finding to a specific user for review, which then appears in the View the Assignment Queue or acknowledge without an assignee that the finding is a valid observation. Invalidate instructs Collibra DQ to ignore a finding and allow the value to pass. There are two invalidation options:
Tip When you have many findings to invalidate, it may be best to use the Save option to invalidate them at the same time, once all findings are reviewed. Resolve Instructs Collibra DQ to mark the finding as an observation and prevents it from appearing in future runs. Resolving a finding does not immediately affect data quality scores. |
| Profile |
The user account that is assigned to this outlier finding. When the Status is Assigned, a user profile displays in this column. Note When an outlier finding is unassigned, the profile column is empty. |
| Link ID |
Links back to the detected record for remediation. Note Link ID is not available for categorical outliers. |
| Action |
Opens the Calibrate outlier modal. |
Note When you assign a Date and Key column in an Outlier configuration, Collibra DQ may also discover Record finding.
Outlier percentage changes
A bar chart and percentage change display when you click the + icon in the Outlier findings table, as shown in the example below.
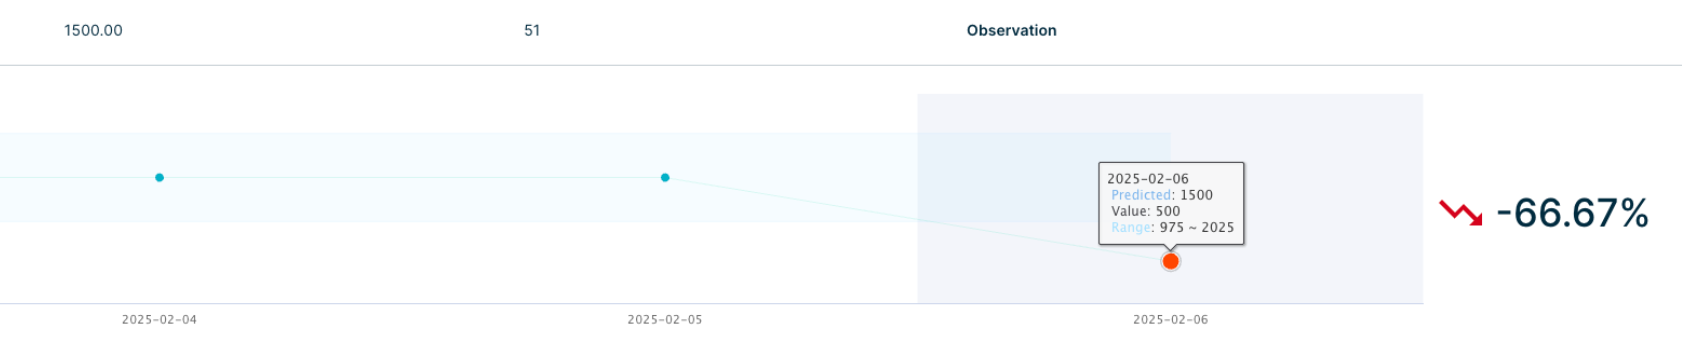
The outlier percentage change is calculated between the value in the latest history data point and the current value. It isn't calculated between the value and predicted value. The calculation uses a buffer (the "weight" or "sensitivity" factor) to adjust the lower and upper boundaries for outliers, making the outlier detection more flexible and adaptable to the specific dataset.
Specifically, outliers are identified using the following process:
-
Define what is considered "typical" in the dataset. This is done using the IQR, which is a statistical measure that represents the range within which the middle 50% of the values in the dataset fall.
-
Calculate the IQR by determining the 25th percentile (Q1) and the 75th percentile (Q3) of the data. These percentiles represent the values below which 25% and 75% of the data fall, respectively. The IQR is the difference between Q3 and Q1.
-
Define what is considered an "outlier" in the dataset. An outlier is defined as any value that falls below (Q1 - 1.5IQR) or above (Q3 + 1.5IQR) the standard range.
-
Introduce a sensitivity factor to make the range more flexible and adaptable to the specific characteristics of the data. This sensitivity factor adjusts the standard range. For example, if the sensitivity is 1.5, then the range is narrowed; if the sensitivity is 0.5, then the range is broadened. For any other sensitivity value, the range is adjusted proportionally.
-
The result is an adjusted range for "typical" values. Any value that falls outside this adjusted range is considered an outlier.
Invalidate All
Invalidate All instructs Collibra DQ to ignore all outlier findings and allow the values to pass.
Exporting outlier records
There are two options above the drill-in table to export the details of your outlier records as .xlsx files:
- Export All (Basic Only) generates an Excel file with the details from the drill-in.
- Export All with Details generates an Excel file with the details from the drill-in and the data preview, when available.