Scorecards provide a historical view of the performance of your datasets, which lets you visualize the health, consistency, and evolution of a dataset over a user-defined date range. By understanding the health of your data through scorecard analysis, you can more accurately schedule routine health checks and help protect downstream process consumers from pulling erroneous data into their models.
The API returns the last 21 scores for each scorecard, starting with the most recent date and working backward. If fewer than 21 scores are available on the first day, it continues searching subsequent days until 21 scores are found. Days without a RunID are skipped. If additional scores are required for other datasets on the same day, the API retrieves them, potentially exceeding 21 scores. With pagination, the API starts from the last searched day's RunID and follows the same logic, skipping periods without jobs.
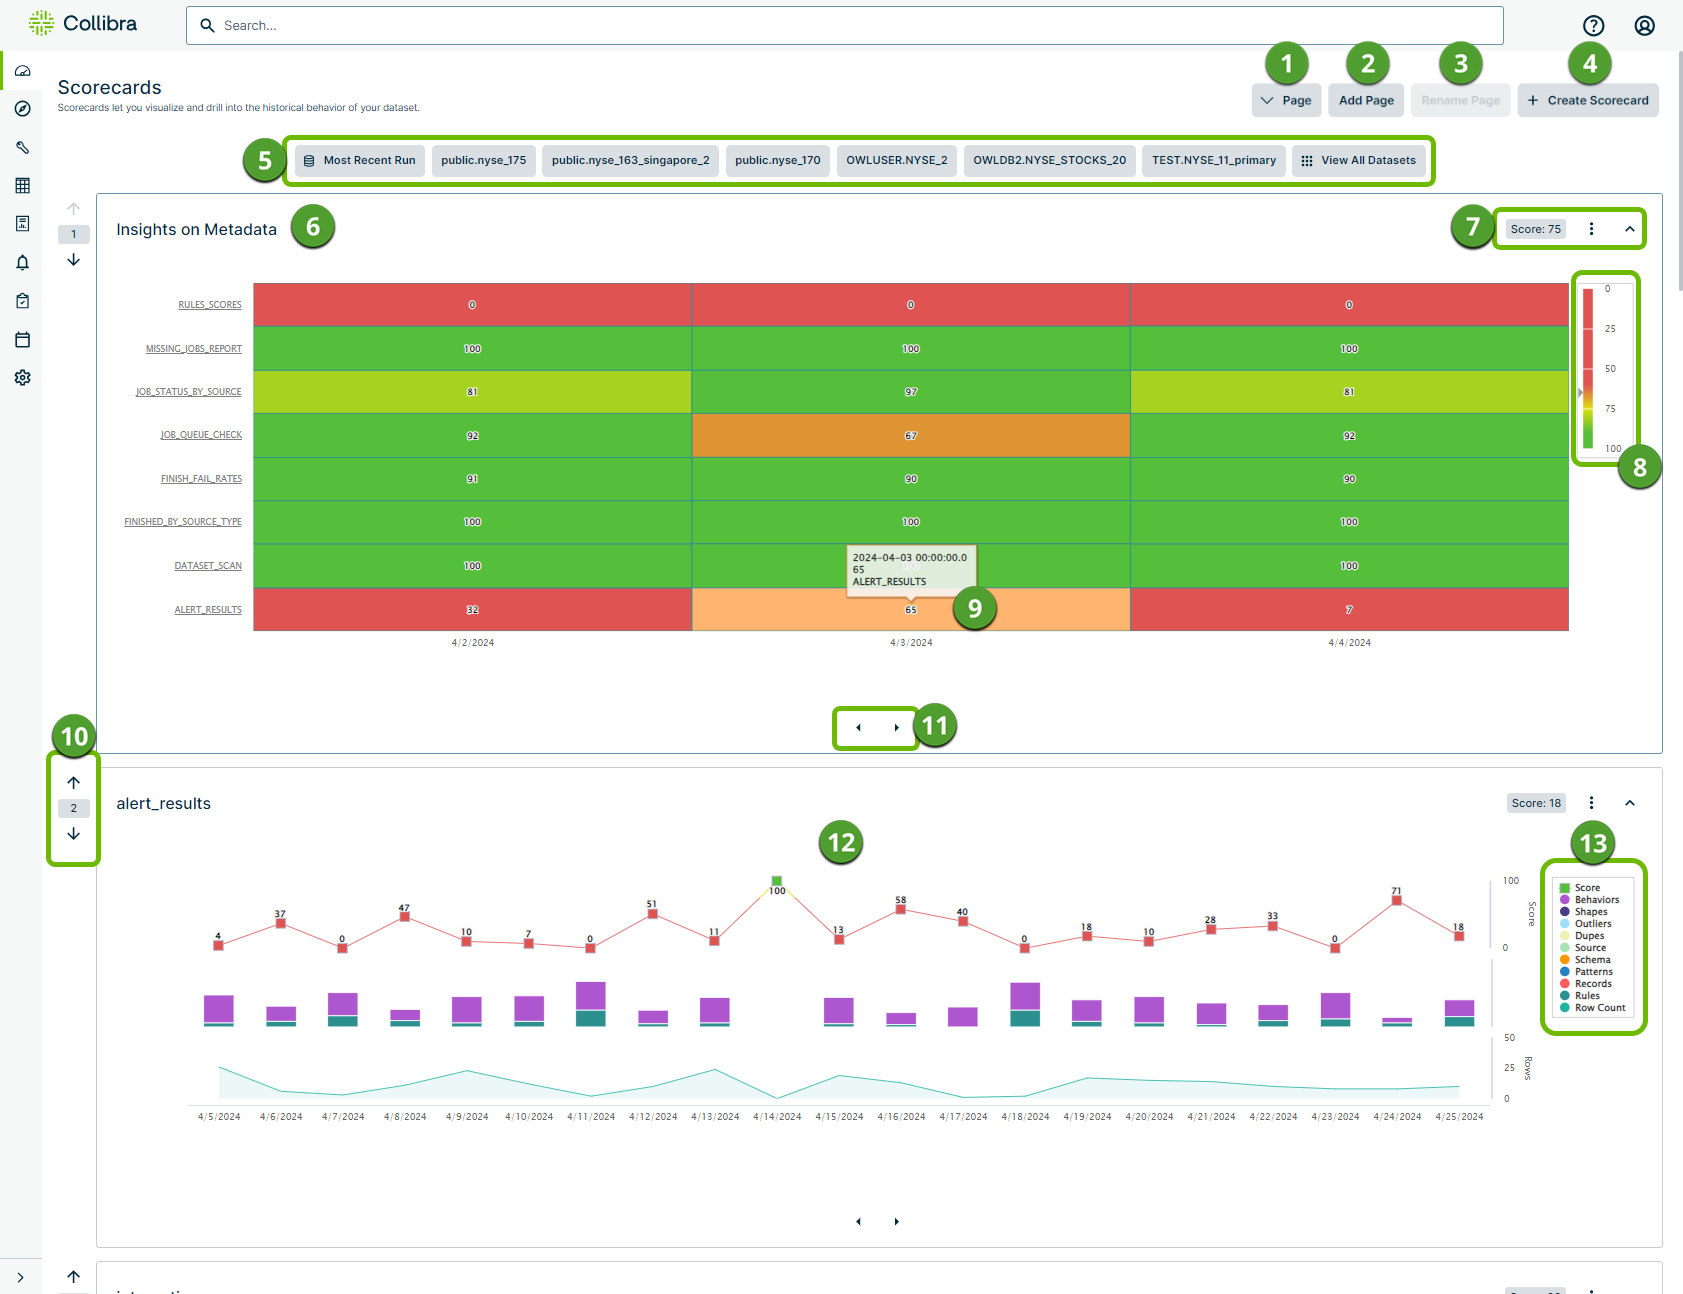
There are two ways to use scorecards:
- Create a scorecard for a single dataset for an overview of all of the layers discovered in particular runs.
- Create a scorecard for multiple datasets at once as a heatmap representing the health of particular runs and giving you an elegant way to compare their scores and quickly access the findings.
| Number | Description |
|---|---|

|
The page dropdown menu allows you to search for and select any available page of scorecards in your environment. A page can contain one or multiple scorecards. When on a specific page, you can click + Create Scorecard to add new scorecards to it. |

|
Allows you to create a new page. Click Add Page and enter a unique name in the text input field, then click Save. Your new page is available in the page dropdown menu. |

|
Allows you to optionally rename a page containing scorecards. Select a page from the page dropdown menu to enable the Rename Page button, then enter a new page name. Note When renaming a page, your new page name must be unique, meaning it cannot be the same as another existing page. If you attempt to save a page with a name that already exists, an error message will appear. |

|
Click + Create Scorecard to create a new scorecard based on one or more datasets in your environment. |

|
The dataset navigation buttons provide quick access to the most recent dataset run, frequently run datasets, and Dataset Manager. |

|
An example of a scorecard based on a compilation of multiple datasets. This scorecard option shows a heatmap of the selected datasets and their scores on the runs from certain days. This option is an excellent way to compare the performance of different datasets over a common date range. |

|
The upper right corner of all scorecards show three components:
|

|
When you hover your cursor over a score in the scorecard, this meter shows the score for the corresponding run. |
|
|
Hover your cursor over a score to see the run date and dataset name on scorecards with multiple datasets, or the run date and score for scorecards with a single dataset. You can also click the score to open the Findings page of that run. |

|
Click the arrows to display data for the available date ranges. |

|
Click the up or down arrow to change the order in which the scorecard displays on the page. |

|
An example of a scorecard based on a single dataset. This scorecard option shows an overview of the score and detected data quality layers from a certain day's run. |

|
A legend that corresponds with the data quality layers depicted on the scorecard. |

Learn how to create a scorecard to view blindspots and scoring trends in your data.