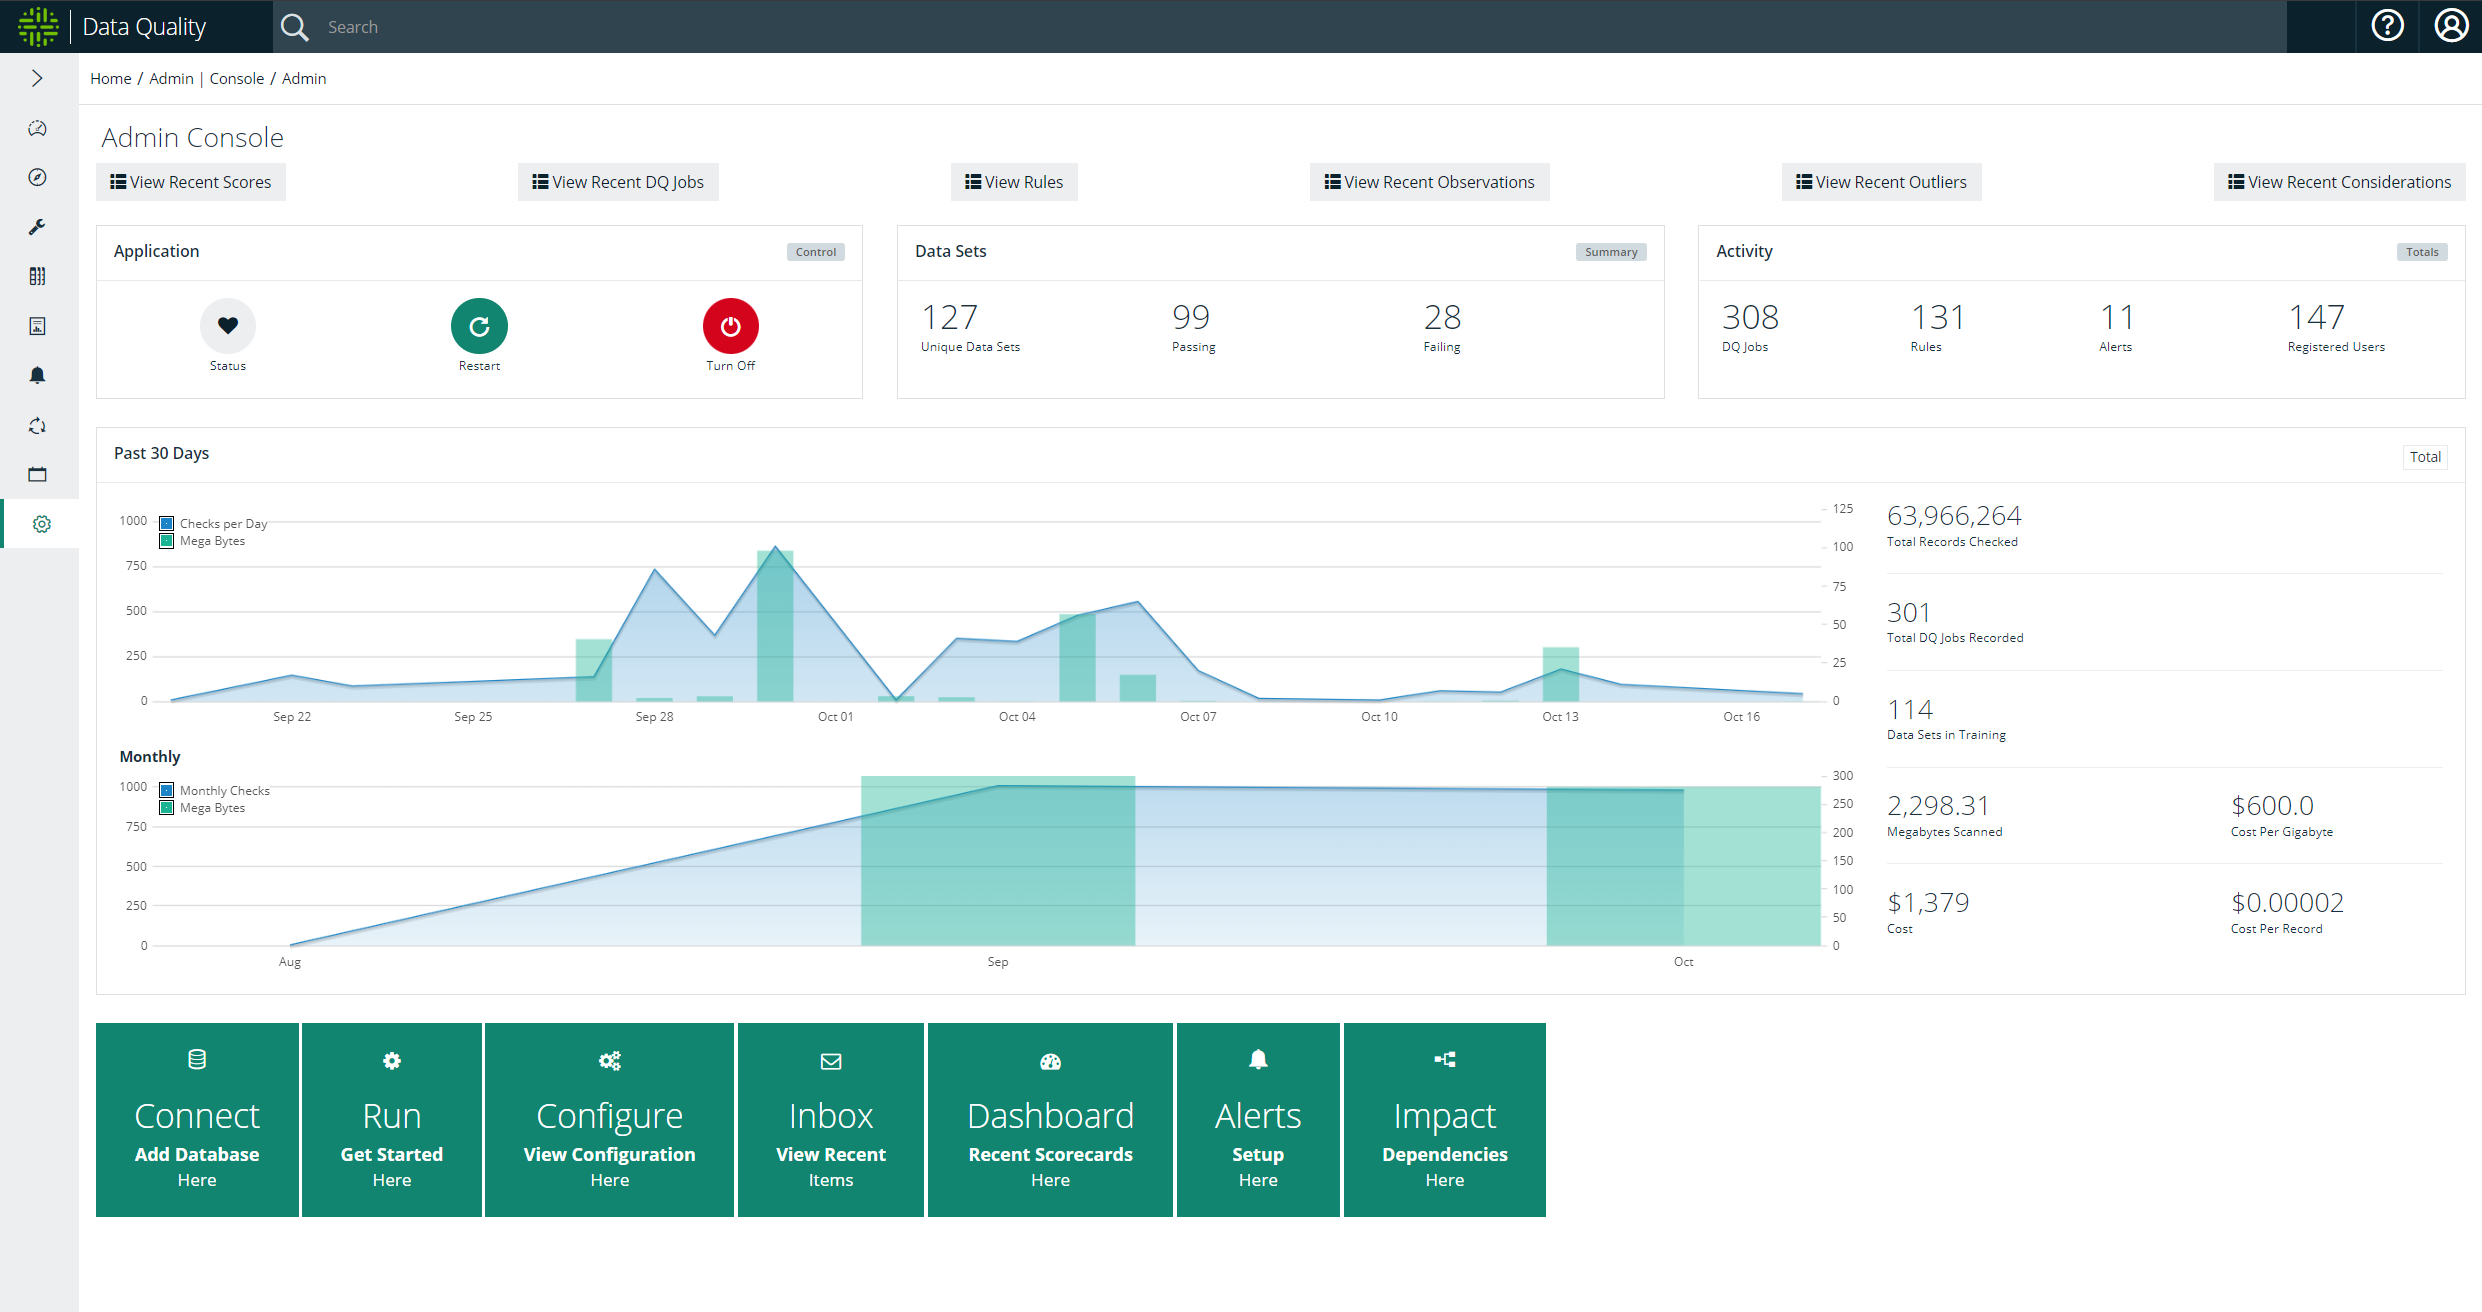
Dashboard, Inventory, Connections, and Configuration are shortcut links to different operations within Data Quality & Observability Classic.
| No. | Component | Details |
|---|---|---|

|
Application controls |
These buttons allow you to:
|

|
User activity | Displays the number of DQ Jobs, rules, alerts, and registered users in Collibra DQ. |

|
Dataset details | Shows the number of unique datasets, passing and failing datasets in Collibra DQ. |

|
Usage statistics over the past 30 days |
Measures the number of DQ Jobs that ran per day and the number of megabytes consumed by those runs over the most recent 30 day period. Additionally, the data points to the right of the chart include:
Tip You can hover your cursor over any of the days on the chart to view the precise details for that day. |

|
Monthly usage statistics |
Measures the number of DQ Jobs that ran per month and the number of megabytes consumed by those runs over the most recent 21 month period. Tip You can hover your cursor over any of the months on the chart to view the precise details for that month. |

|
Shortcuts |
Quickly navigate to the following pages in the application:
|