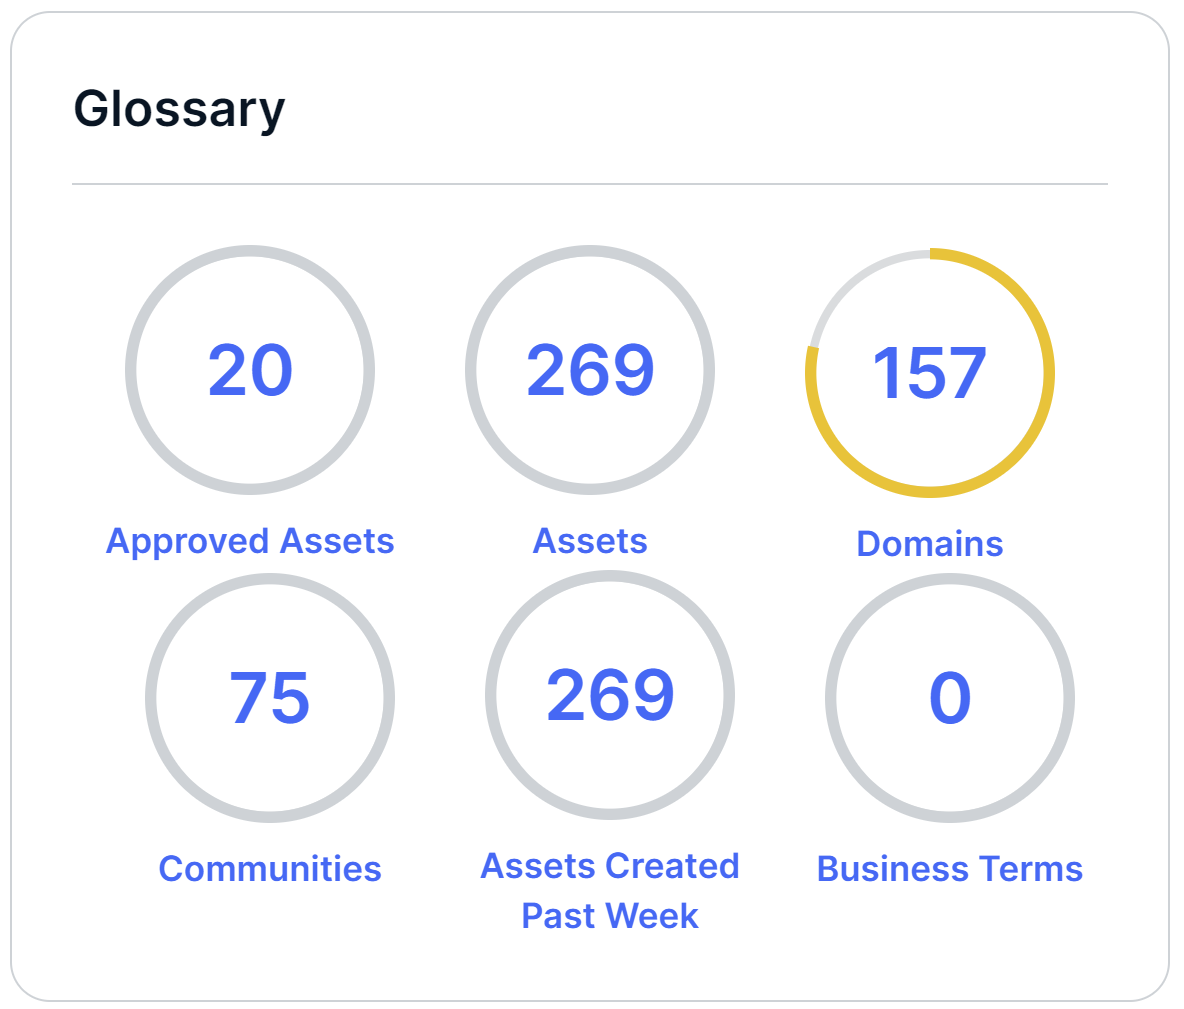
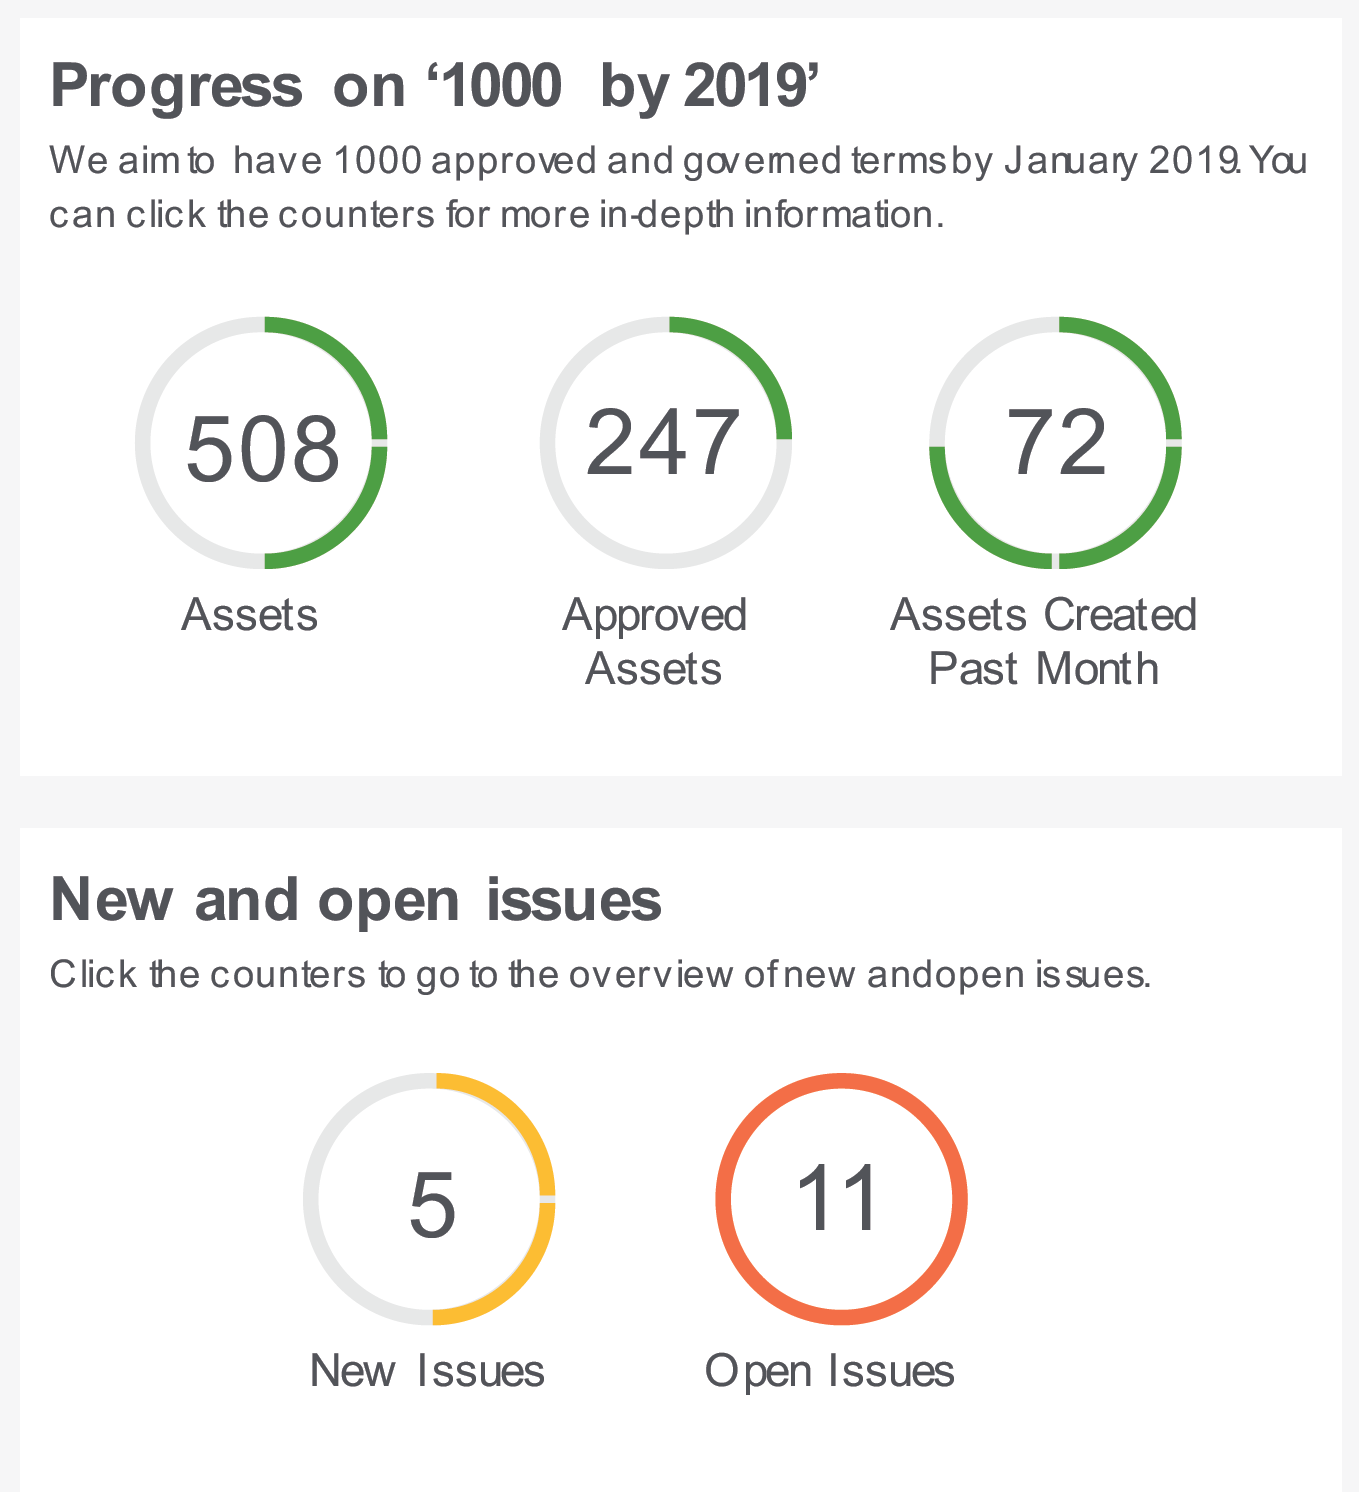
The Counters widget shows the count statistics on a dashboard. It provides information such as the number of assets in your environment or the number of open tasks or issues. You can also configure warning and danger thresholds, which allow you to visually communicate certain risk or tolerance levels for Issue assets.
- The counters for asset types also include their respective child asset types. Therefore, the count shown on the widget for a given asset type may be more than the count shown elsewhere for the same asset type.
- You can't filter on custom assets.
Templates
When configuring the Counters widget, you can choose from a predefined list of templates. These templates determine the count statistics that are computed.
The following table describes the available templates.
| Template | Description |
|---|---|
| Applications | Number of Technology Assets. |
| Approved Assets | Number of assets whose status is Accepted. |
| Assets | Number of assets. |
| Assets Created Past Day | Number of assets created in the last 24 hours. |
| Assets Created Past Month | Number of assets created in the last 28 days. |
| Assets Created Past Week | Number of assets created in the last 7 days. |
| Business Terms | Number of Business Term assets. |
| Data attributes | Number of Data attribute assets. |
| Data entities | Number of Data entity assets. |
| Data models | Number of Data model assets. |
| Code Values | Number of Code Value assets. |
|
Columns |
Number of Column assets. |
| Communities | Number of communities. |
| Data Assets | Number of Data assets. |
| Domains | Number of domains. |
|
File Groups |
Number of File Group assets. |
|
Files |
Number of File assets. |
| Governance Assets | Number of Governance assets. |
| Issues Resolved Past Day |
All issues in the Resolved status that were updated in the last 24 hours. Note The last update to an issue is typically the status change to Resolved. However, this counter also includes issues already in the Resolved status that received any other update, such as a comment or field change, within the last 24 hours. |
| Issues Resolved Past Week |
All issues in the Resolved status that were updated in the last 7 days. Note The last update to an issue is typically the status change to Resolved. However, this counter also includes issues already in the Resolved status that received any other update, such as a comment or field change, within the last 24 hours. |
| KPIs | Number of Key Performance Indicators. |
| Your Open Tasks |
Number of unfinished tasks for the user. Note Unfinished is the status of the task, as documented in the workflow. |
| New Issues | Number of Issue assets whose status is New. |
| Open Issues |
Number of unresolved Issue assets. Unresolved Issue assets can have the following statuses:
|
| Open Tasks |
Number of unfinished tasks for all users. Note Unfinished is the status of the task, as documented in the workflow. |
| Processes | Number of Business Process assets. |
| Reference Data Domains | Number of Code-list domains. |
|
Reports |
Number of Report assets. |
|
S3 Buckets |
Number of S3 Bucket assets. |
|
S3 File Systems |
Number of S3 File System assets. |
|
Schemas |
Number of Schema assets. |
|
Tableau Dashboards |
Number of Tableau Dashboard assets. |
|
Tableau Projects |
Number of Tableau Project assets. |
|
Tableau Servers |
Number of Tableau Server assets. |
|
Tableau Sites |
Number of Tableau Site assets. |
|
Tableau Stories |
Number Tableau Story assets. |
|
Tableau Views |
Number of Tableau View assets. |
|
Tableau Workbooks |
Number of Tableau Workbook assets. |
|
Tables |
Number of Table assets. |
| Task Duration | Sum of all task durations in days. |
| Users |
Number of user sessions that are currently active. Note This number may be greater than the number of active licenses assigned to your organization, because every user may have more than one active session. |