Data Analysis Expressions (DAX) is a programming language used in Power BI for creating calculated columns, measures, and custom tables. Calculated columns and measures in Power BI are ingested in Data Catalog as Power BI Column assets.
Collibra Data Lineage uses AI to analyze DAX queries and create column-level lineage for your calculated columns and measures. This enables stitching between calculated columns in the technical lineage and the corresponding Power BI Column assets in Data Catalog.
During integration, Collibra Data Lineage extracts DAX queries from your Power BI metadata and sends them to an ML platform for analysis. The ML platform analyzes the query text to identify the tables and columns involved, and returns the results to Collibra Data Lineage to build lineage and create relations between Power BI Column assets.
- DAX analysis is powered by AI-based analysis. While Collibra takes measures to improve consistency, the results are not fully deterministic. Results may vary between scans, and lineage may occasionally be incomplete or inaccurate, even for identical DAX queries.
- The ML platform analyzes only the DAX query text. It has no knowledge of your broader data model, such as table names or schema. This is why results may occasionally be incomplete or inaccurate, even for identical DAX queries.
Tip For information about how we leverage AI in our products, including how we handle data that is used for training and input, go to the Collibra Trust Site.
Enable DAX analysis
To enable this feature, select the Enable lineage for DAX queries option when you add your Power BI Edge capability.
Attributes on Power BI Column asset pages
The following attribute types on Power BI Column asset pages are relevant for DAX analysis:
- Role in Report
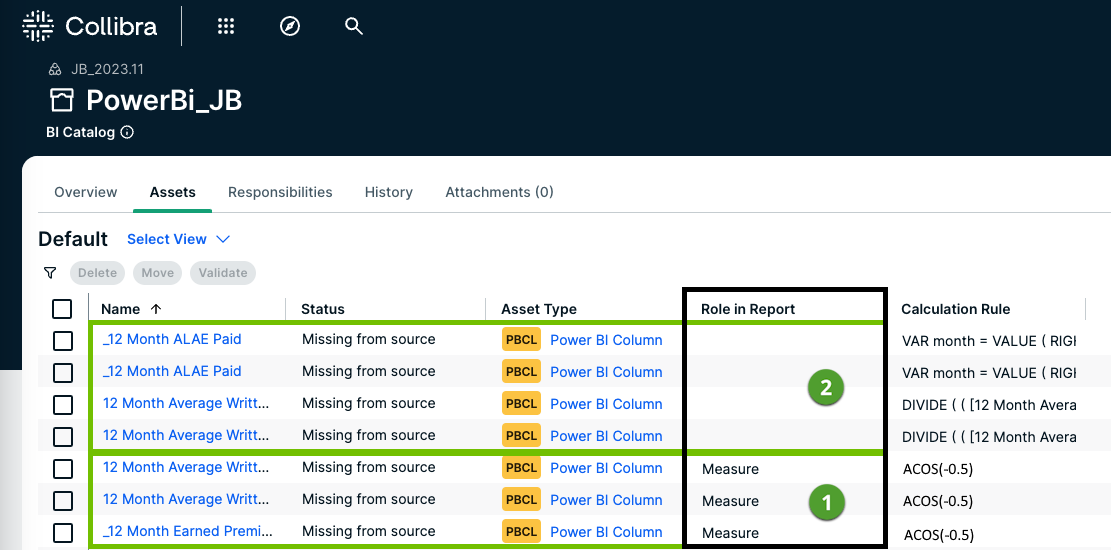
 For measures, the Power BI API returns sufficient information for Collibra Data Lineage to identify the columns as such. Therefore, the value of the Role in Report attribute is shown as Measure.
  For calculated columns, the Power BI API can't distinguish between native columns (those read from the data source or evaluated by a query written in Power Query M or Power BI) and calculated columns. Therefore, no value is shown for the Role in Report attribute.
 - Calculation Rule
The Calculation Rule attribute type shows the DAX query of calculated columns and measures, and calculated tables. All elements of the DAX query are included, such as comments. The Technical Data Type attribute indicates the data type of the column, for example String or Number.
The Calculation Rule attribute type is part of the global assignment of the Power BI Column asset type and cannot be deleted.
If the Calculation Rule attribute type is not showing on the asset page, ensure that the attribute type is part of the global assignment of the Power BI Column and Power BI Table asset types. By default, it is not included.
Results in the technical lineage graph
With DAX analysis enabled:
- All of the source columns used to compute a calculated column are shown in the technical lineage graph.
- Calculated columns and measures are indicated by the AI icon (
 ) next to the column name.
If the AI icon () is not shown next to a column name, DAX analysis may not be enabled, or the calculation is static and has no lineage.
Collibra Data Lineage cannot create lineage for DAX calculations that involve numbers, for example the ACOT function.
Examples
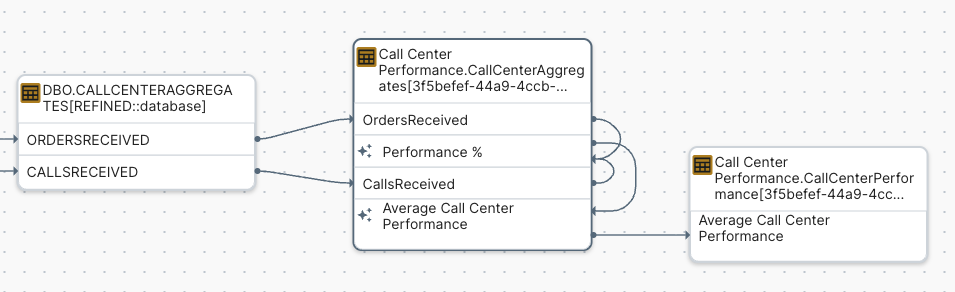
In the following example image:
- The source columns ORDERSRECEIVED and CALLSRECEIVED that are used to derive the calculated columns Performance % and Average Call Center Performance are shown in the graph.
- Outbound edges from the data source show the relation between the source columns and the calculated columns in the downstream dataset.
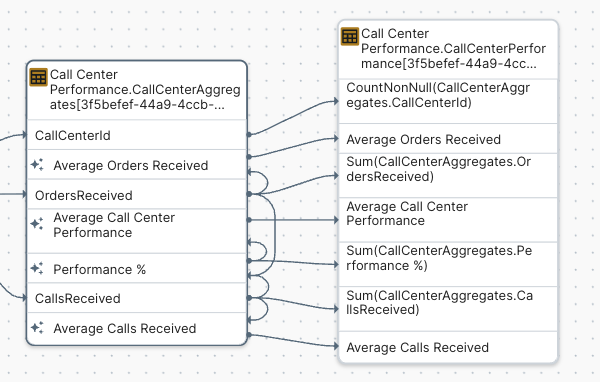
If you zoom out to the table-level lineage:
- The source columns used to derive the calculated columns are shown in the graph.
- The calculated columns Performance % and Average Call Center Performance are shown.
Tooltips in the technical lineage graph
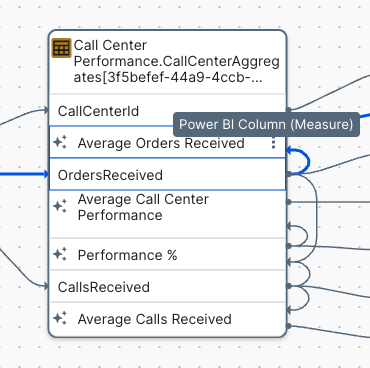
If you hover over a calculated column, the tooltip identifies it as "Power BI Column (Calculated)".
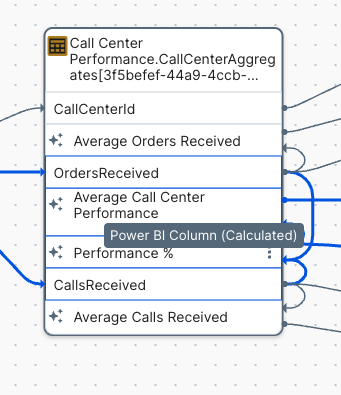
If the column is a measure, the tooltip identifies it as "Power BI Column (Measure)".
Review the results of DAX analysis
- Open the asset page of a Power BI Report, Power BI Column or Power BI Table, and then click Technical lineage.
- In the technical lineage toolbar, click
 .
.
The source code pane opens. Here you can see the DAX query and compare it to the lineage.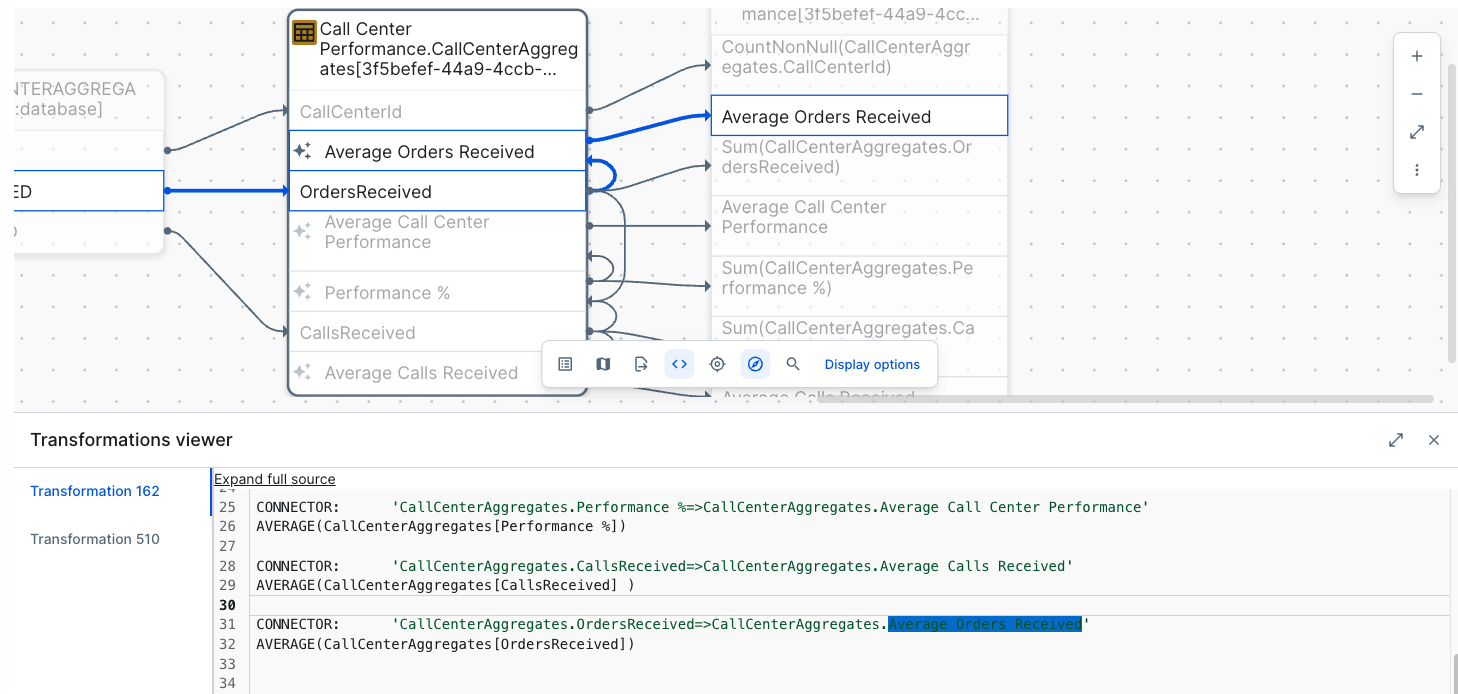
- In the technical lineage toolbar,
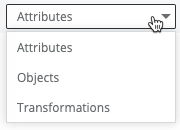
in the drop-down list, select Objects and Transformations, to see a high-level view.
Costs and character limit
Collibra Data Lineage calculates the number of characters in the DAX queries that are sent to the ML platform, and the number of characters in the analyzed queries that the ML platform returns to the Collibra Data Lineage service instance for processing. The total number of input, output, and embedded characters determines the cost of the analysis.
Collibra covers the cost of the analysis. Collibra Data Lineage does, however, limit the number of DAX characters processed for a job. The limit is intended to restrict only the largest amounts of metadata, in consideration of the cost of processing. Under certain circumstances, Collibra can raise the limit. For more information, contact Collibra Support.
If the character limit is reached, the following error message is shown in the source code:
Maximum amount of DAX queries is reached. Please use workspace filtering.
If this occurs, use workspace filtering to limit the amount of Power BI metadata that is processed.
Measures to reduce costs and drive quality
Collibra takes the following measures to help reduce costs and drive quality.
Cached queries and results
The first time you integrate or synchronize Power BI after enabling this feature, Collibra Data Lineage processes all of your DAX queries – with respect to the character limit – and caches them. The analyzed queries that are returned by the ML platform are also cached. As such, during subsequent synchronizations, if a specific DAX query is encountered, it doesn't need to be processed again. Caching helps to reduce costs, improve performance, and ensure higher-quality results from the ML platform.
If you reach the character limit, Collibra Data Lineage only shows the lineage of the cached calculations. No new lineage will be created, but this does not negatively affect the ingestion job.
Example store
To help prevent against missing lineage, we've built an example store, which is a collection of example DAX queries. the ML platform refers to the example store to know if a specific query format is known and, if so, how it was previously processed. Upon request, we can add new format examples to the store, to have a more complete collection and reduce the chances of an incorrect or missing lineage.
If you encounter incorrect or missing lineage, create a Collibra Support ticket. Collibra will either anonymize your query or build it in our own environment and then add it to the example store.
AI temperature
AI temperature is a number between 0 and 2, which determines the randomness of the output. The higher the setting, the more random the results. The lower the setting, the more deterministic the results.
For this feature, the AI temperature is set to 0 to reduce randomness and improve consistency. This means the system prioritizes avoiding incorrect lineage over generating potentially inaccurate results.
A temperature of 0 reduces randomness but does not guarantee identical results across scans. If you encounter inconsistent or missing lineage, go to Example store to improve results.