Data usage statistics and popularity scores help data consumers understand how frequently data in a data source is used. This information can indicate that the data is valuable and trustworthy.
- Currently, the JDBC registration process can synchronize the data usage statistics and calculate a popularity score only for Snowflake.
- This feature is available only in the latest UI for Commercial Cloud customers and when the scalable ingestion flow is enabled.
- The popularity score of an asset is recalculated twice a day and takes the data usage statistics of the last 30 days of the last gathered information into account.
Retrieve data usage statistics and popularity score
As a data steward, to synchronize the usage statistics of data in a Snowflake data source and calculate a popularity score, your data source connection must have the required permissions and you must select the Include Data Usage Statistics option when defining the synchronization rules for a schema.
After the synchronization, the following data usage information becomes available for Table, View, and Column assets:
- Number of distinct users: The number of people who used the asset in a query on the source system within a specific time frame. During the synchronization, this information is gathered from the data source for the past 30 days.
- Number of queries: The number of times the asset has been part of a query on the source system within a specific time frame. During the synchronization, this information is gathered from the data source for the past 30 days.
- Popularity score: This score is calculated by Collibra and indicates how often an asset is used in queries on the source system compared to all other assets for which the data usage statistics have been ingested in Data Catalog. Tables and Columns are calculated separately.
The possible popularity score values are: Very high, High, , Low, and None. The value is available in the Popularity Score attribute of an asset. A No score value means that the Popularity Score attribute doesn't contain a value.
For more information, go to Popularity score calculation.
Tip When you start synchronizing usage statistics, the scores are not loaded for past data. It may take a couple of days before you start seeing results.
View data usage statistics and popularity score
As a data consumer, you can check the popularity score to understand how frequently data in the data source is used. The Popularity Score field is shown in the At a glance sidebar for Table, View, and Column assets. You can also add this attribute to table asset views and in the asset pages.

|

|
When you click Show details for a popularity score in the At a glance sidebar or click the Popularity Score value in a view, a dialog box appears with the following sections.
-
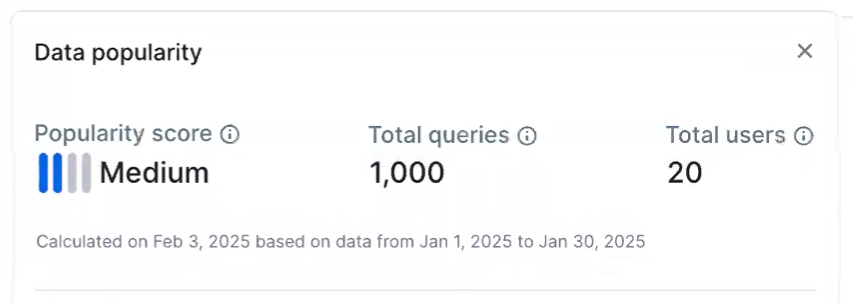
Data popularity: Shows the popularity score, the number of queries, and the number of distinct users of the data.
- Popularity score: The popularity score reflects the latest calculated score for the asset, which refreshes twice a day. For details, go to Popularity score calculation.
Collibra recalculates the popularity score of an asset twice a day. It uses the usage statistics of the last 30 days of the last gathered information. This means the popularity can be high even though no results appear for the defined query history. - Total queries: The total number of queries from the last time the 30-day data was gathered.
- Total users: The total number of distinct users of the data from the last time the 30-day data was gathered.
- Popularity score: The popularity score reflects the latest calculated score for the asset, which refreshes twice a day. For details, go to Popularity score calculation.
-
Query History: Shows the number of queries within a specific date range. You can change the date range. When you do, the current date is always the last day in the date range. The possible values are:
- Last week: Shows the last 7 days, from the first date in the date range until the last. The data point shows the number of queries for that day.
- Last month, Last 3 months, and Last 6 months: Divides the date range into groups of 7 days, starting from the first date in the date range. For each 7-day period, the total number of queries during that week is calculated and shown as a data point at the end of the week.
Popularity Score values with the value None can't be clicked to get the details.
Example of the query history chart for date range Last 3 months
For the following query history chart, created on 26 August 2025, the date range Last 3 months is selected. As a result, the date range is set to May 26 - August 26, 2025, and is divided into 7-day periods in the chart.
- The data point for May 26th is 0. This means that on May 26, no queries were made on the data.
- The data point for Jun 01 is 0. This means that between May 26 and June 1, no queries were made on the data.
- The data point on June 8 is 12. This means that between June 1 and June 8, the data was queried 12 times.

Popularity score calculation
The popularity score is calculated as follows:
- For the ingested assets, Collibra calculates a numeric score for ingested assets based on the number of queries and distinct users. It uses identifiers to protect user privacy while still showing if interactions are from the same or different users. To do this:
- Metrics are sourced from SNOWFLAKE.ACCOUNT_USAGE.ACCESS_HISTORY
- Only read operations are included — any query that made a change to data or structure is excluded.
- All identities (service accounts, automated processes, and users) from the USER_NAME column are counted.
- User data is anonymized via hashing before processing.
- The assets are ordered by the calculated numeric score and split into 5 groups.
- Based on the assigned group, the Popularity Score value of an asset is set.
The possible values are:- If an asset has not been queried, the Popularity Score value is None.
Popularity Score values with the value None can't be clicked to see extra details.Note The None value is also used when an asset previously had a popularity score but hasn't been resynchronized for more than 30 days.
- If the asset is in the lowest 25% of assets, <=P25, the Popularity Score value is Low.
- If the asset is in the second group, >P25 and <=P50, the Popularity Score value is Medium.
- If the asset is in the third group, >P50 and <=P75, the Popularity Score value is High.
- If the asset is in the highest 25% of assets, >P75, the Popularity Score value is Very High.
A No Score value means that the Data Usage statistics for the asset are collected, but the popularity score hasn't been calculated yet. The value will be updated during the next recalculation. The No Score value doesn't appear in the Popularity Score column in a view.
- If an asset has not been queried, the Popularity Score value is None.
The popularity score of an asset is recalculated twice a day and takes the data usage statistics of the last 30 days of the last gathered information into account.
Related topics
Helpful resources
Popularity scores training on Collibra University