Monitoring data quality in assets
The Quality tab of an asset makes data quality results of the asset available for business stakeholders. It shows values collected over time for attributes and values aggregated from different assets based on predefined relations.
The assets for which the Quality tab is available and how the values are aggregated are defined in data quality rules, which are configured on the Data quality rules tab on the Settings page.
Choose an option below to explore the documentation for the latest user interface (UI) or the classic UI.
Asset quality
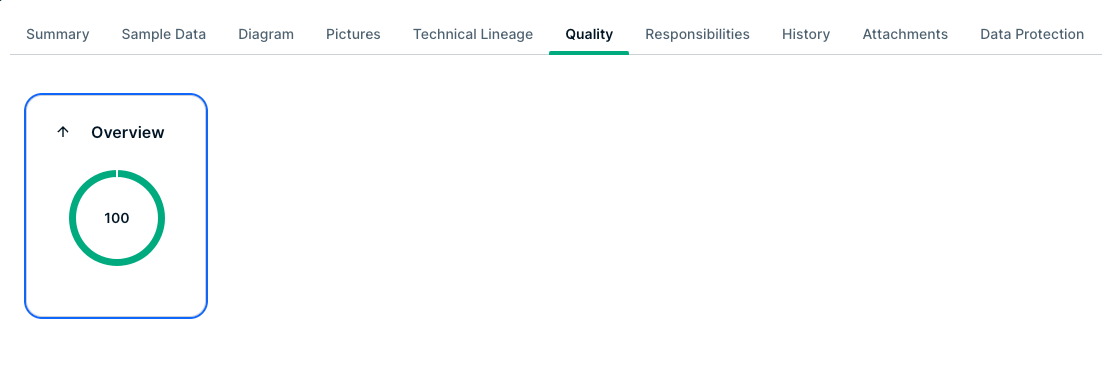
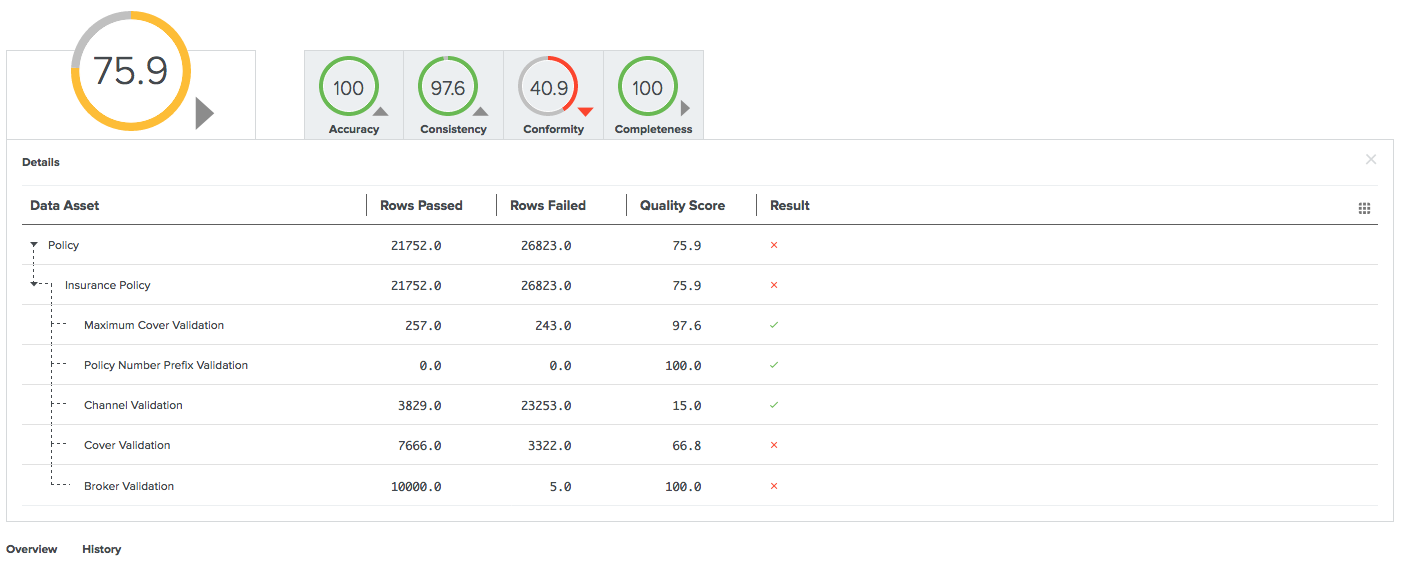
The Quality tab of an asset shows the aggregated passing fraction (quality score) for the asset in the form of ring charts.


Each ring chart shows the quality score in the form of:
- A quality score as a percentage.
- A color code indicating the quality of this passing fraction:
- Red: 0-50%
- Orange: 50-85%
- Green: 85 - 100%
The first ring chart shows the general score of the asset. The ring charts next to it shows subscores for a specific dimension, such as Accuracy, Conformity, Completeness, and Consistency. Only values that belong to that specific dimension are then considered. The dimensions to use are configured in the metric group. In this example, it is the relation: Data Quality Rule is Classified By Data Quality Dimension.
Underneath the top pane, three selection boxes show additional overview, details, and history.
Overview
The Overview pane shows more information about each level in the aggregation path for the selected general score or dimension. For each level, it shows the number of involved assets of a certain type and what their results are: failing (red) or passing (gray). It also shows the total number of rows, the number of failing rows (red), and the number of passing rows (gray) that resulted in the given scores.

In the following example, the Conformity dimension consists of a total of 38070 rows, 26575 of which were failing. 2 data quality rules were involved, 1 of which was failing. These data quality rules were used by 1 data entity, which has an aggregated failing result.

Details
The Details pane shows more information about all the involved assets in a tabular format.
For each asset, a row with the following default columns is shown:
- Data Asset: Data asset signifier.
- Rows Passed: Number of passing rows, aggregated as a sum of the passing rows of the underlying assets.
- Rows Failed: Number of failing rows, aggregated as a sum of the failing rows of the underlying assets.
- Quality Score: Score aggregated, as an average of the quality scores of the underlying assets.
- Result (failing or passing): Aggregated result, as a logical conjunction of the results of the underlying assets.


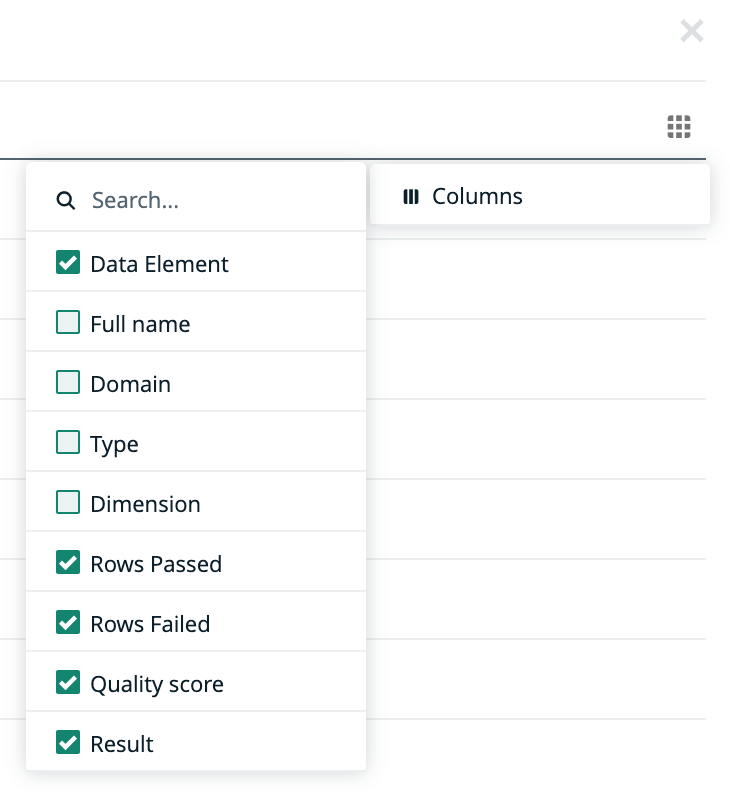
You can show some extra columns in the table by clicking ![]() → Columns. These include:
→ Columns. These include:
- Data Element: Unique full name of the asset.
- Domain: Domain to which the asset belongs.
- Type: Type of the asset.
- Quality Score: Aggregated value between 0 and 100 that represents a summary of the integrity of your data.
If you use an external data quality tool (anything other than Data Quality & Observability) and the Quality Score calculation is incorrect because a null/empty value is treated as a zero, then you can disassociate the data quality rule or metric from the asset. To disassociate the data quality rule or metric from the asset:
-
Navigate to the Summary tab for the asset.
-
Scroll to the section that displays the relationship between the asset and the rule or metric. For example, if the asset is of type Data Quality Job, then scroll to the “is governed by Data Quality Rule” section.
-
Locate the rule or metric with a missing Passing Fraction value.
-
In the Actions column, click
next to the rule or metric to remove the association.
- Dimensions: Dimension that applies to these assets, if any. Dimensions are used to calculate subscores.

History
The History pane shows the evolution of the quality score over the last 7 days of data.
You can show the date and the score for a specific period at the upper-right corner of the pane by hovering your pointer over that period. When you select a period by clicking it, the upper-left corner of the pane shows a trend of the score compared to the period before it.

