Monitoring services
For the extended monitoring of your environments, you have to install the Monitoring service and define the interval between two scrapes. This service will store the following metrics in its database:
- Java Virtual Machine metrics (CPU, memory)
- Async threads metrics
- Database metrics
- API metrics
- Logging metrics
You can add this monitoring data to a diagnostics file for further investigation.
The monitored services are:
- Data Governance Center
- Jobserver and Spark
- Monitoring
The monitoring service will only monitor the mentioned services if they are running in the same environment. For example, if you have a Collibra Data Intelligence Cloud environment with an on-premises Jobserver and Monitoring service, then the Monitoring service will only monitor the on-premises Jobserver.
Live monitoring
You can view live information about the DGC service and Repository service that are running in a given environment, in the Monitoring tab of the respective service pages.
Note The live monitoring uses a different monitoring service than the separately installed monitoring service.
Example
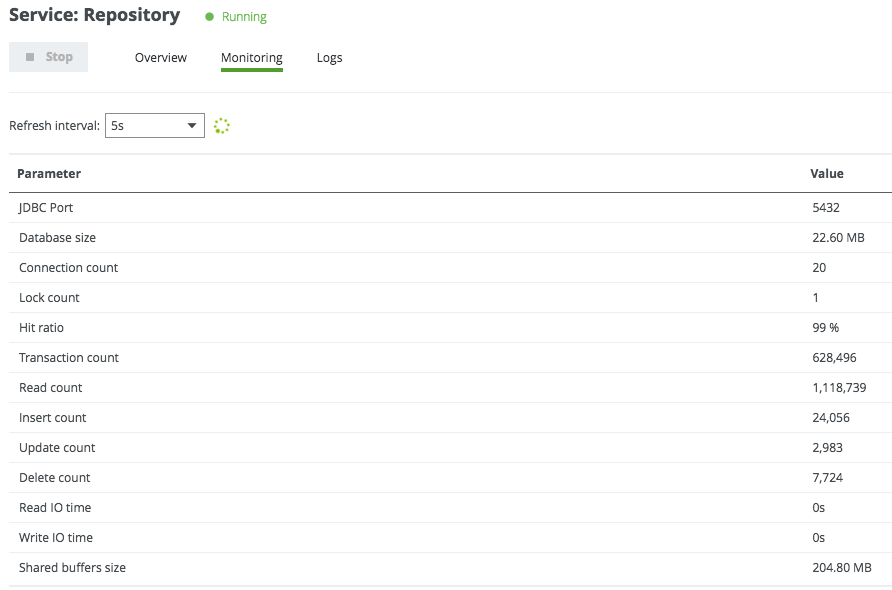
Use the Refresh interval drop-down menu to define how frequently you want the values refreshed. The default value is five seconds.
You can also: