Synchronizing means refreshing the assets that are currently in Data Catalog as a result of a previous ingestion or synchronization job. After synchronizing Qlik, the assets in Data Catalog accurately reflect the metadata as it exists at the time of synchronization.
- The assets have the same names as their corresponding data objects in Qlik.
- Relations that were created between Qlik assets and other assets via any of the relation types in the Qlik operating model, are deleted upon synchronization. The same is true of any attribute types in the operating model that you manually add to Qlik assets. To ensure that the characteristics you add to Qlik assets are not deleted upon synchronization, use characteristics that are not part of the Qlik operating model.
The following image shows the relations between Qlik asset types.
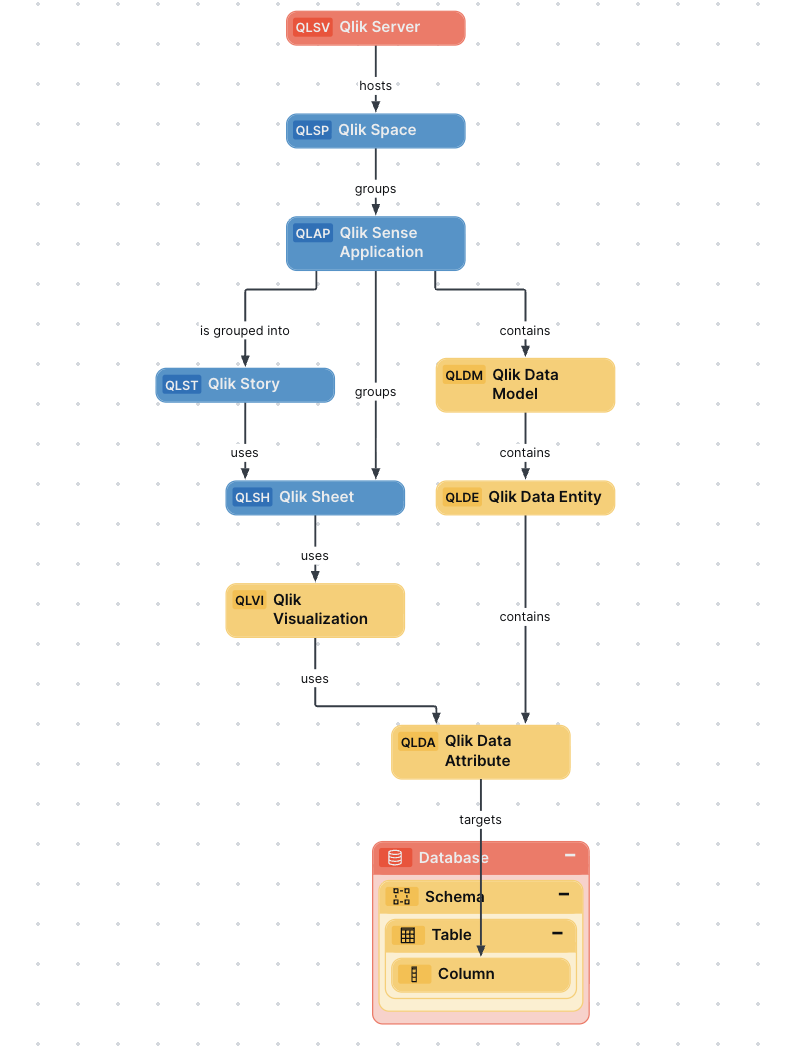
You can easily recreate this diagram view in your Collibra environment. See Create a Qlik operating model diagram view.
Harvested metadata per asset type
This table shows the harvested Qlik metadata for each Qlik asset type.
|
Asset type |
Synchronized metadata |
Public ID |
|---|---|---|
|
Qlik Server Public ID: QlikServer |
Description |
Description |
| URL | Url | |
| Server (Qlik Server) hosts / is hosted in Business Dimension (Qlik Space) | ServerHostsBusinessDimension | |
|
Qlik Space1 Public ID: QlikSpace |
Description | Description |
| Description from source system | DescriptionFromSourceSystem | |
| Document creation date | DocumentCreationDate | |
| Document modification date | DocumentModificationDate | |
|
Owner in Source The only harvested metadata are email addresses. |
OwnerInSource | |
| Business Dimension (Qlik Space) groups / is grouped into Report (Qlik Sense Application) | BusinessDimensionGroupsReport | |
|
Qlik Sense Application Public ID: QlikSenseApplication |
Description |
Description |
| Description from source system | DescriptionFromSourceSystem | |
| Document creation date | DocumentCreationDate | |
| Document modification date | DocumentModificationDate | |
|
Owner in Source The only harvested metadata are email addresses. |
OwnerInSource | |
| State | State | |
| URL | Url | |
| Report (Qlik Sense Application) groups / is grouped into Report (Qlik Story or Qlik Sheet) | ReportGroupsReport | |
| BI Report (Qlik Sense Application) contains / contained in BI Data Model (Qlik Data Model) | BIReportContainsBIDataModel | |
|
Qlik Sheet Public ID: QlikSheet |
Description |
Description |
| Description from source system | DescriptionFromSourceSystem | |
| Report (Qlik Sheet) uses / used in Report Attribute (Qlik Visualization) | ReportUsesReportAttribute | |
|
Qlik Story Public ID: QlikStory |
||
| Description | Description | |
| Description from source system | DescriptionFromSourceSystem | |
| Document creation date | DocumentCreationDate | |
| Owner in Source | OwnerInSource | |
| Report (Qlik Story) uses / used in Report (Qlik Sheet) | ReportUsesReport | |
|
Qlik Visualization Public ID: QlikVisualization |
||
| Description | Description | |
| Description from source system | DescriptionFromSourceSystem | |
|
Report (Qlik Visualization) uses / used in Data Attribute (Qlik Data Attribute) |
ReportUsesDataAttribute | |
|
Qlik Data Model Public ID: QlikDataModel |
No attributes. This is only a connecting point for related assets. | |
|
Data Entity (Qlik Data Entity) is part of / contains Data Model (Qlik Data Model) |
DataEntityIsPartOfDataModel | |
|
Qlik Data Entity Public ID: QlikDataEntity |
Description | Description |
| Location | Location | |
| Table Type | TableType | |
| Data Entity (Qlik Data Entity) contains / is part of Data Attribute (Qlik Data Attribute) | DataEntityContainsDataAttribute | |
|
Qlik Data Attribute Public ID: QlikDataAttribute |
Column Position | ColumnPosition |
| Definition | Definition | |
| Description | Description | |
| Technical Data Type | TechnicalDataType | |
| Data Element (Qlik Data Attribute) targets / sources Data Element (Column) | DataElementTargetsDataElement | |
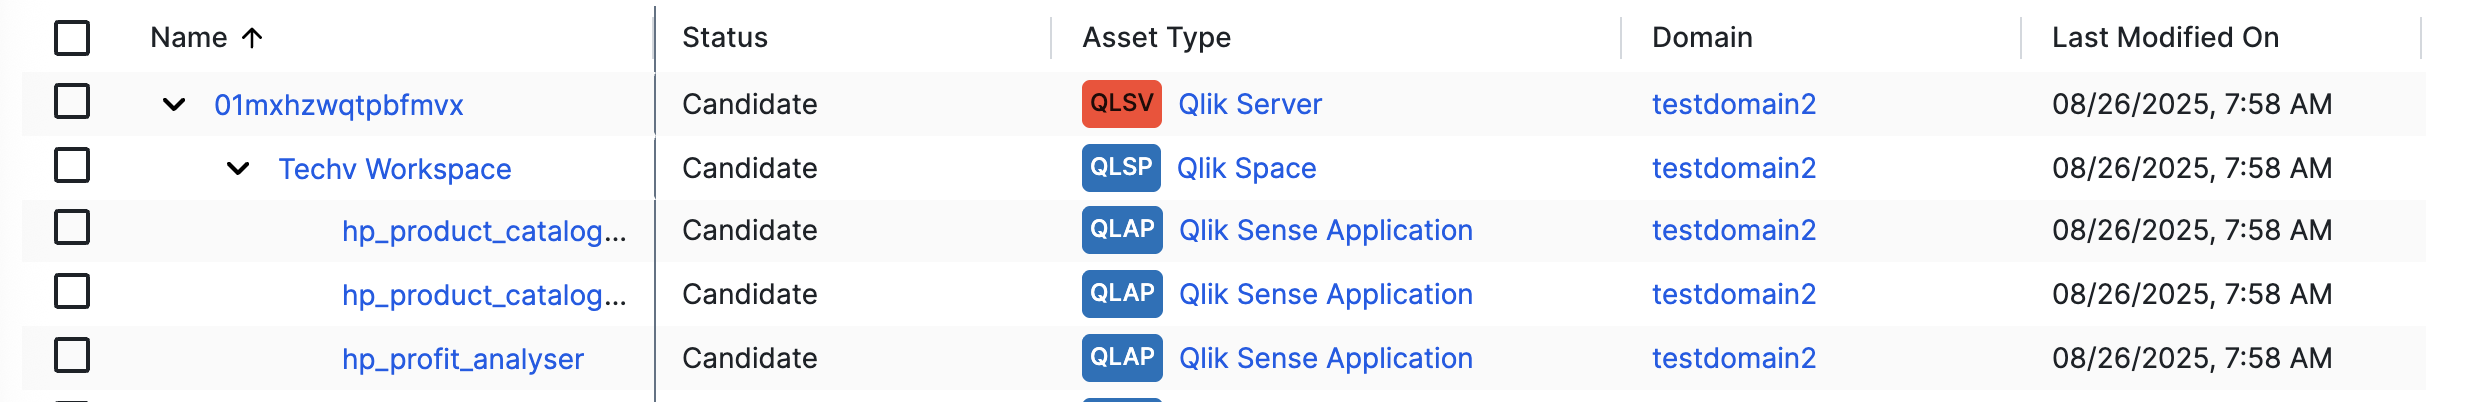
Example of ingested Qlik metadata
The following image shows an example structure after synchronizing Qlik.
Recommended hierarchy within a domain
You can enable hierarchies for the domain (or domains) in which your Qlik assets were ingested. Doing so makes it easier to understand the relation between your Qlik assets when viewing the assets on the domain page.
Follow these steps to enable and configure the recommended hierarchy.
Steps
- Open the domain page of the relevant BI Catalog domain.
- On the content toolbar, click
 .
.
The Configure Hierarchy dialog box appears. - Select Enable Hierarchy.
- Select Multipath.
- Start typing and select each of the following relation types:
- Server hosts Business Dimension
- Business Dimension groups Reports
- Report is grouped into Report
- Report used in Report
- Report uses Report
- BI Report contains BI Data Model
- Data Model contains Data Entity
- Data Entity contains Data Attribute
- Data Element targets Data Element
- Click Apply.
- In an asset view, if any asset is deleted, for example via synchronization or manual deletion, the view is recreated and the hierarchy is lost. In this case, you can again enable and configure the recommended hierarchy.
- When viewing the hierarchy for a community or domain, if the parent of a node that is in the community or domain belongs to a different community or domain, that node is not shown in the hierarchy.
Create a Qlik operating model diagram view
You can create a Qlik-specific diagram view, to visualize the operating model. The following procedure provides instruction on how to quickly create a new diagram view by copying and pasting the JSON code in the diagram view text editor.
Steps
- Open the asset page.
- Click the
Diagram tab.
The diagram is shown in the default diagram view. - Click
 to add a new view.
 - Select the Text option below the diagram view name.
The diagram view text editor is shown. - Copy the code from the Show JSON code section below and paste it in the diagram view text editor.
- Click Save.
- Edit the name and description of the diagram view as needed.
{
  "nodes": [
    {
      "id": "Qlik Server",
      "type": {
        "id": "00000000-0000-0000-0000-100000000080"
      }
    },
    {
      "id": "Qlik Space",
      "type": {
        "id": "00000000-0000-0000-0000-100000000081"
      }
    },
    {
      "id": "Qlik Sense Application",
      "type": {
        "id": "00000000-0000-0000-0000-100000000082"
      }
    },
    {
      "id": "Qlik Sheet",
      "type": {
        "id": "00000000-0000-0000-0000-100000000083"
      }
    },
    {
      "id": "Qlik Visualization",
      "type": {
        "id": "00000000-0000-0000-0000-100000000084"
      }
    },
    {
      "id": "Qlik Data Model",
      "type": {
        "id": "00000000-0000-0000-0000-100000000086"
      }
    },
    {
      "id": "Qlik Data Entity",
      "type": {
        "id": "00000000-0000-0000-0000-100000000087"
      }
    },
    {
      "id": "Qlik Data Attribute",
      "type": {
        "id": "00000000-0000-0000-0000-100000000088"
      }
    },
    {
      "id": "Column",
      "type": {
        "id": "00000000-0000-0000-0000-000000031008"
      }
    },
    {
      "id": "Qlik Story",
      "type": {
        "id": "00000000-0000-0000-0000-100000000085"
      }
    },
    {
      "id": "Table",
      "type": {
        "id": "00000000-0000-0000-0000-000000031007"
      }
    },
    {
      "id": "Schema",
      "type": {
        "id": "00000000-0000-0000-0001-000400000002"
      }
    },
    {
      "id": "Database",
      "type": {
        "id": "00000000-0000-0000-0000-000000031006"
      }
    }
  ],
  "edges": [
    {
      "from": "Qlik Server",
      "to": "Qlik Space",
      "label": "",
      "style": "arrow",
      "type": {
        "id": "00000000-0000-0000-0000-120000000000"
      },
      "roleDirection": true
    },
    {
      "from": "Qlik Space",
      "to": "Qlik Sense Application",
      "label": "",
      "style": "arrow",
      "type": {
        "id": "00000000-0000-0000-0000-120000000002"
      },
      "roleDirection": true
    },
    {
      "from": "Qlik Sense Application",
      "to": "Qlik Sheet",
      "label": "",
      "style": "arrow",
      "type": {
        "id": "00000000-0000-0000-0000-120000000004"
      },
      "roleDirection": true
    },
    {
      "from": "Qlik Sheet",
      "to": "Qlik Visualization",
      "label": "",
      "style": "arrow",
      "type": {
        "id": "00000000-0000-0000-0000-120000000007"
      },
      "roleDirection": true
    },
    {
      "from": "Qlik Sense Application",
      "to": "Qlik Data Model",
      "label": "",
      "style": "arrow",
      "type": {
        "id": "00000000-0000-0000-0000-120000000015"
      },
      "roleDirection": true
    },
    {
      "from": "Qlik Data Model",
      "to": "Qlik Data Entity",
      "label": "",
      "style": "arrow",
      "type": {
        "id": "00000000-0000-0000-0000-000000007046"
      },
      "roleDirection": false
    },
    {
      "from": "Qlik Data Entity",
      "to": "Qlik Data Attribute",
      "label": "",
      "style": "arrow",
      "type": {
        "id": "00000000-0000-0000-0000-000000007047"
      },
      "roleDirection": true
    },
    {
      "from": "Qlik Data Attribute",
      "to": "Column",
      "label": "",
      "style": "arrow",
      "type": {
        "id": "00000000-0000-0000-0000-000000007069"
      },
      "roleDirection": true
    },
    {
      "from": "Qlik Visualization",
      "to": "Qlik Data Attribute",
      "label": "",
      "style": "arrow",
      "type": {
        "id": "00000000-0000-0000-0000-120000000021"
      },
      "roleDirection": true
    },
    {
      "from": "Qlik Sense Application",
      "to": "Qlik Story",
      "label": "",
      "style": "arrow",
      "type": {
        "id": "00000000-0000-0000-0000-120000000004"
      },
      "roleDirection": false
    },
    {
      "from": "Qlik Story",
      "to": "Qlik Sheet",
      "label": "",
      "style": "arrow",
      "type": {
        "id": "00000000-0000-0000-0000-120000000007"
      },
      "roleDirection": true
    },
    {
      "from": "Table",
      "to": "Column",
      "label": "",
      "style": "boxing",
      "type": {
        "id": "00000000-0000-0000-0000-000000007062"
      },
      "roleDirection": true
    },
    {
      "from": "Schema",
      "to": "Table",
      "label": "",
      "style": "boxing",
      "type": {
        "id": "00000000-0000-0000-0000-000000007062"
      },
      "roleDirection": true
    },
    {
      "from": "Database",
      "to": "Schema",
      "label": "",
      "style": "boxing",
      "type": {
        "id": "00000000-0000-0000-0000-000000007024"
      },
      "roleDirection": true
    }
  ],
  "showOverview": false,
  "enableFilters": false,
  "showLabels": true,
  "showFields": true,
  "showLegend": true,
  "showPreview": true,
  "visitStrategy": "directed",
  "layout": "HierarchyTopBottom",
  "maxNodeLabelLength": 50,
  "maxEdgeLabelLength": 30,
  "layoutOptions": {
    "compactGroups": false,
    "componentArrangementPolicy": "topmost",
    "edgeBends": true,
    "edgeBundling": true,
    "edgeToEdgeDistance": 5,
    "minimumLayerDistance": "auto",
    "nodeToEdgeDistance": 5,
    "orthogonalRouting": true,
    "preciseNodeHeightCalculation": true,
    "recursiveGroupLayering": true,
    "separateLayers": true,
    "webWorkers": true,
    "nodePlacer": {
      "barycenterMode": true,
      "breakLongSegments": true,
      "groupCompactionStrategy": "none",
      "nodeCompaction": false,
      "straightenEdges": true
    }
  }
}