In CPSH 2025.09, we launched a new user interface (UI) for technical lineage viewer.
Use the following options to see the documentation for the latest or classic technical lineage viewer UI:The latest technical lineage viewer UI is in public preview. For support, open issues in the Collibra Preview Program.
The technical lineage graph consists of nodes and edges. Each node represents a corresponding object in a data source. Each edge shows a relation between nodes.
Nodes and edges in the technical lineage graph show how data flows from source to destination. A clearer understanding of nodes and edges enhances your technical lineage experience.
Consider the following visual elements in the technical lineage graph:
- Relation types
- Colors
- Icons
- Arrows
- Collapsed attributes menu
- Right-click menu
- SELECT statements that result in "-RES" tables in the lineage
Relation types
The technical lineage graph shows relations between columns in the graph. Collibra Data Lineage creates and shows the following relation type between stitched assets and other data objects:
|
Head |
Role |
Co-role |
Tail |
Public ID |
|---|---|---|---|---|
|
Data Element |
targets |
sources |
Data Element |
DataElementTargetsDataElement |
Colors
The technical lineage graph shows different colors to indicate which data objects are stitched to assets in Data Catalog and which are not.
Background colors
The background color of a node indicates whether or not the data object was stitched to an asset in Data Catalog, and whether something went wrong.
A node has one of the following background colors:
|
Color |
Description |
|---|---|
|
Yellow |
Data objects from your data source that are stitched to assets in Data Catalog |
|
Gray |
Data objects, for example temporary tables and columns, that Collibra Data Lineage collects from your data sources, but are not stitched to assets in Data Catalog. |
Since a technical lineage shows how data flows from source to destination, it is possible to see a lineage graph with yellow and gray nodes.
Font colors
The font color of a data object in the technical lineage graph indicates whether there is a relation between this data object and one or more other data objects.
A node has one of two font colors:
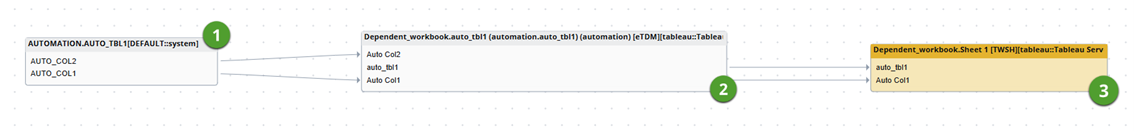
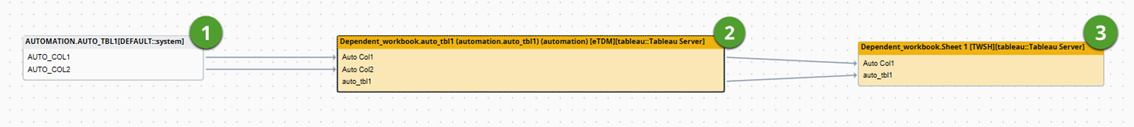
- Node 1 contains data objects with no incoming edges from other data objects in the technical lineage.
- Node 2 contains data objects that do not have a relation to other data objects.
- Node 3 contains data objects with no outgoing edges to other data objects.
Icons
CPSH uses the following icon in the technical lineage graph.
|
Icon |
Description |
|---|---|

|
The name of a table was found by the full-text search in the source code on which the analysis failed. Consequently, the lineage flow of the table is probably incomplete. If you click Show failed SQLs on the right click menu of the table, the failed SQL queries appear in the source code pane at the bottom of the page. |
|
|
A relation for the data objects exists, but it isn't shown, for example because you set the technical lineage flow depth to a lower value than the actual graph size. |
Arrows
Arrows are incoming or outgoing edges that show how the data flows from source to destination. They represent relations of the type "Data Element sources / targets Data Element".
There are two ways in which an arrow can be shown:
|
Arrow type |
Description |
|---|---|
|
Single |
Shows the full lineage without skipping certain data objects. |
|
Dot |
Shows that there are hidden data objects in the technical lineage graph. This happens when only the endpoints of the technical lineage flow are shown. |
Example The following Technical lineage graph shows the edge with a dot, which indicates that there are other nodes between these nodes in the full technical lineage flow.
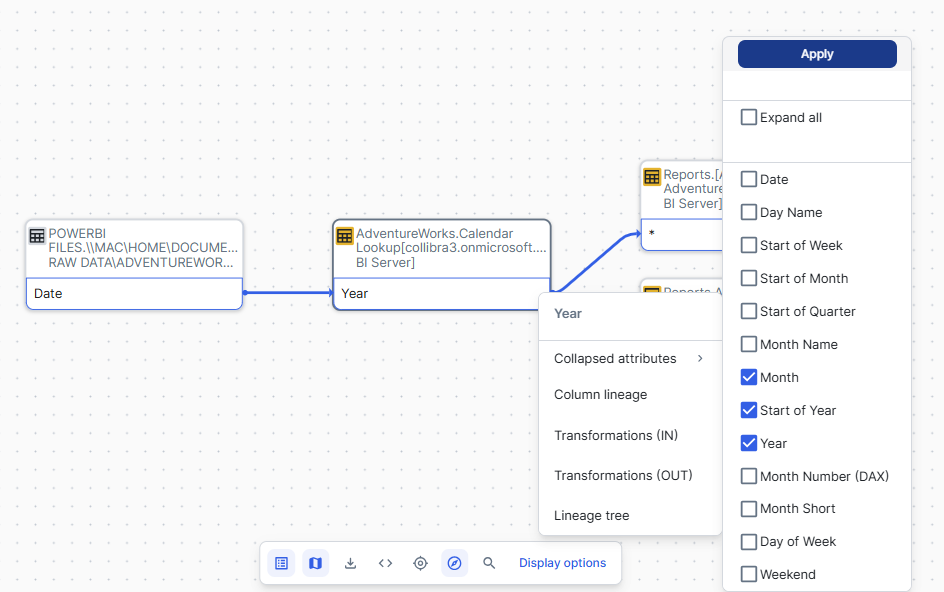
Collapsed attributes menu
If you select a specific column in a table with multiple columns, you can right-click the column and click Collapsed attributes to show all other columns or only the selected columns in the same table.
Right-click menu
If you right-click a node, you can perform several specific actions on that node.
|
Functionality |
Description |
|---|---|
| Column/Table lineage | Switch to the technical lineage graph of the selected column or table. |
| Transformation (IN) |
Show the transformation logic of the incoming source code fragments in the source code pane. |
| Transformation (OUT) |
Show the transformation logic of the outgoing source code fragments in the source code pane. |
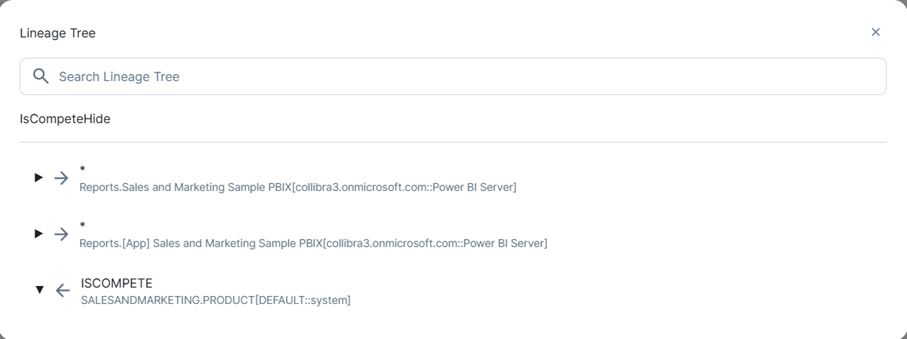
| Lineage tree |
Show an alternative way to view the flow of data objects, called the lineage tree. The lineage tree is particularly useful if there are many nodes in a lineage. It enables you to see the entire lineage in one pop-up, which means you no longer have to scroll through the technical lineage graph to see the full lineage. The lineage tree uses arrows to visualize the traceability of data objects:
|
|
Custom features |
When the lineage flow of the table is incomplete or there is an issue in the source code of a data object, the right-click menu shows the Show failed SQLs option. If you click this option, the source code pane opens and shows the SQL queries that failed. |
SELECT statements that result in "-RES" tables in the lineage
If you have SQL SELECT statements like the following, the results are not put into a table because they are not used in a DDL or DML query, such as INSERT or CREATE VIEW AS.
SELECT username, email
FROM dbo.users
In such cases, Collibra Data Lineage creates a dummy table, so that a complete lineage can be achieved. The dummy table has the name of the SQL file, and is appended with "-RES", as follows: "<filename>.SQL-RES".
To avoid the need for Collibra Data Lineage to create a dummy, you can add an INSERT or CREATE VIEW statement before your SELECT statement, for example:
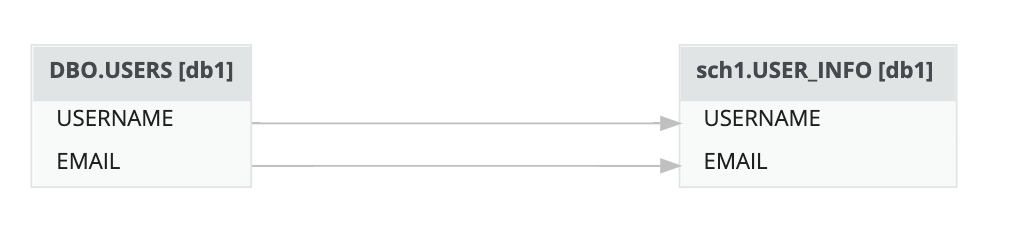
CREATE VIEW user_info AS
SELECT username, email
FROM dbo.users
The resulting lineage is as follows: