About the rule workbench
Note This feature is only available for Pushdown jobs.
From the rule workbench, you can:
- Add custom SQL rule monitors to existing jobs with user-defined
- Configure automated notifications to send to users when your rule is passing, breaking, or returning an exception.
- Preview the results of your rule to ensure it will return the expected output before your job runs.
- Associate data quality dimensions with your rule to help you group and report on the data quality monitoring.
- Filter the data from your job to include only the rows most relevant to your rule use case.
- Apply a tolerance setting to define the percentage of rule breaks required to affect rule statuses and trigger notifications tied to the rule.
Rule monitoring strategies
Data quality monitoring works best when you combine automatic anomaly detection with specific business validation:
- Adaptive rules: Adaptive rules, also known as out-of-the-box monitors, serve as the entry point for behavioral data profiling. Without the need for manual SQL compilation, they automatically detect unexpected anomalies, such as data type, row count, or schema changes. While they provide essential baseline coverage to help you better understand the data, they may not provide the precise coverage needed to address specific business needs.
- User-defined rules: User-defined rules must be expressly defined to enforce specific business logic. Use these to catch known invalid states that the adaptive rules model cannot predict, such as the pediatric patient scenario described in the use case section below.
Rule use case
Consider a scenario where a healthcare organization needs to ensure the accuracy of their patient records. Business requirements state that no patient over the age of 18 should be categorized as a "pediatric" patient.
To automate this check, a data quality manager uses the rule workbench to write a custom SQL query. The query selects any records that violate this logic. This includes rows where the age is greater than 18, but the patient is still listed as pediatric.
SELECT * FROM @ALDER_PRACTICE_PATIENTS WHERE PEDIATRIC = 'Y' AND DATE('2025-01-01') - BIRTHDATE > 18 * 365
If the job runs and finds records that match this query, the rule status changes to breaking. This notifies the data steward or other downstream users to investigate the specific rows that contain the invalid data.
Note For hands-on training related to this scenario, check out the Data Quality rules: They're meant to be broken course in Collibra University.
Overview of the rule workbench user interface
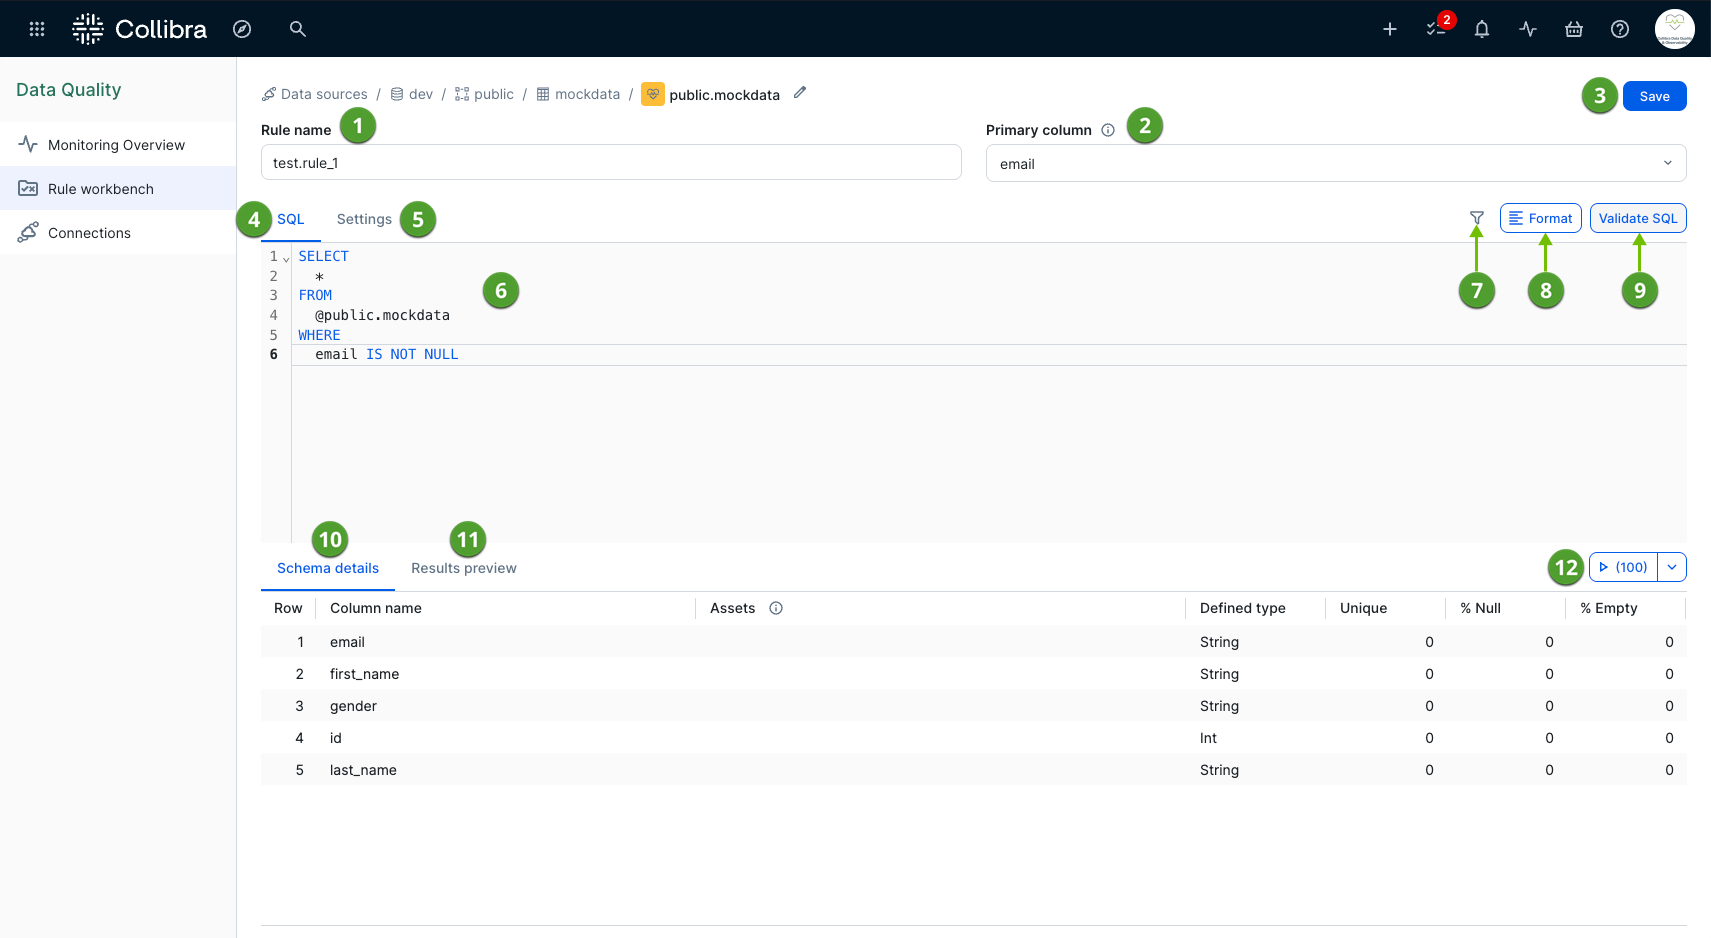
The following image and sections describe the key functional areas of the rule workbench, grouped by their primary purpose.
Rule setup and management
This section contains the fundamental configuration details and settings required to establish your custom rule.
- Rule name (
 ): The unique name of your custom rule. You cannot use a name that is already in use by another rule in the job. Rule name can contain periods (.), underscores (_), and hyphens (-). You cannot use any other special characters.
 - Primary column (
 ): The Primary column drop-down list allows you to set a primary column from your table. Collibra can then associate your rule with a column asset based on the selected primary column.
 - Save (
 ): The Save button saves your rule as a rule monitor for your job. The rule monitor runs automatically the next time your job runs.
 - Settings (
 ): The settings tab allows you to associate data quality dimensions with your rule, define a rule tolerance percentage, and add notifications and a description.
SQL definition and validation
This section contains the tools and reference information necessary to write, filter, and validate your custom query.
- SQL (
 ): The SQL tab allows you to enter a custom SQL query and, if needed, the filter query. The SQL query identifies records that violate its conditions, helping you detect unusual, unexpected, or inaccurate data. When a violation, known as a rule break, occurs, the system marks the state of the rule as breaking on the Monitors tab of the Job Details page. If no rule breaks occur, the system marks the state as passing.
 - SQL editor (
 ): The SQL editor allows you to edit your custom SQL. When available, it provides typeahead suggestions for elements of a SQL query, such as operators, table names, and column names.
 - Filter query (
 ): A filter query allows you to narrow the scope of your rule by adding a secondary query definition to limit the total number of rows included in the rule. It uses a simple query format, such as
 SYMBOL IS NOT NULLorLOW > 25, and must include only conditions and predicates that appear after theWHEREclause in a SQL statement. For example, a correct filter query for results in the "low" column of a NYSE table isLOW > 25. You cannot use full SQL statements, such asSELECT * FROM PUBLIC.NYSE WHERE LOW > 25, in the filter query. - Format (
 ): The Format button automatically formats the SQL query for better readability.
 - Validate SQL (
 ): The Validate SQL button validates the syntax of your SQL query.
 - Schema details (
 ): The Schema details tab provides an overview of the columns of your table. It serves as a helpful reference point when adding your SQL rule and helps you determine the type of rules to create.
Note When you run a job with rules that include a rule tolerance percentage, only the rules with percentages of breaking records greater than their tolerance thresholds impact the data quality score.
Rule testing and preview
This section allows you to test your rule against a sample of your data to ensure accuracy before executing it against your entire job.
- Results preview (
 ): After you enter a valid SQL query in the SQL editor and specify the number of sample rows using the run preview button, you can preview the results of your rule on the Results preview tab. This ensures that the rule returns the expected break record output before the job runs.
 - Run preview button and row sample selector (
 ): The Run preview button allows you to preview the results of your rule based on the number of sample rows you select from the row sample drop-down list.