Completeness Report
What is Data Completeness?
Completeness answers the question of what percentage of your data is complete, or "filled in" (i.e., not EMPTY or NULL). Using this report, you can view the completeness of a column, a collection of tables, a business unit or data set (file or table), or almost any completeness query.
Completeness of your data is important because it shows whether data is inaccurate, invalid, the wrong type, or missing altogether, which can leave you without any data. Sometimes data values can be missing for valid reasons, which requires a better understanding of the context of whether the missing data is bad for business or acceptable.
You can generate the Completeness report from the Reports page.
Steps
-
Sign in to the Collibra DQ instance and click the
 Reports icon in the left navigation pane.
The Reports page opens. - Click the Completeness Report link.
- From the Dataset Filter dropdown list, select one of the following options:
- Business Unit
- From the Business Unit dropdown list, select a specific business unit or All, to select all datasets.
- Proceed to step 4.
- Dataset
- In the Dataset search field, enter a dataset for which you want to run the report. You can also enter a partial word to locate data sets in the system.
- Proceed to step 4.
- Business Unit
- From the Date Filter dropdown list, select one of the following options:
- Last x Days: the number of days back to include in the report.
- From the Last x Days dropdown list, select one of the following options:
- 1 day
- 2 days
- 7 days
- 10 days
- 15 days
- Proceed to step 5.
- From the Last x Days dropdown list, select one of the following options:
- Custom Range: the custom range you set for Run Date/Update Time.
- From the Date Column dropdown list, select one of the following options:
- Run Date: the date/time the data represents.
- Update Time: time the DQ job ran.
- In the Date Range fields, select a date range by clicking in the from/to fields and selecting the dates using the interactive calendars.
- Proceed to step 5.
- From the Date Column dropdown list, select one of the following options:
- Last x Days: the number of days back to include in the report.
- From the Run Mode dropdown list, select one of the following options:
- All: includes all jobs in the system.
- DRAFT: includes only the jobs that are in draft mode.
- PUBLISHED: includes the jobs that have been published.
- Click Go.
Note When looking at completeness over time, you should differentiate between the time the DQ job ran (update time) or the date/time the data represents (run date). For example, you could load stock data today but the data loaded was for last week.
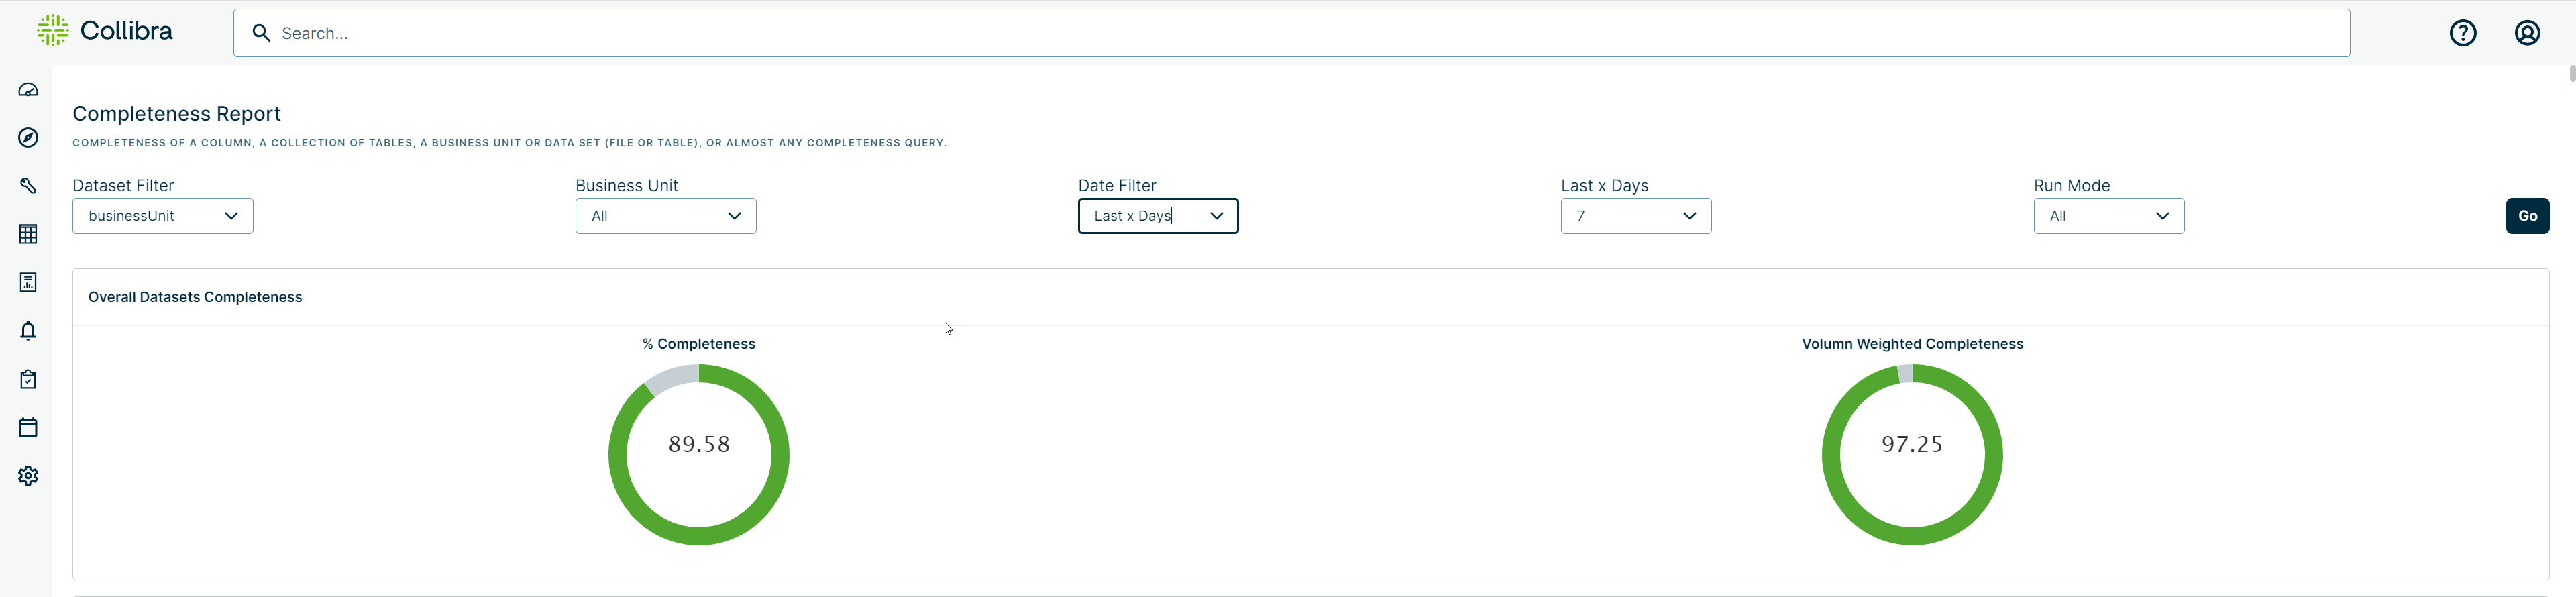
All View
The All view represents the completeness of datasets throughout the entire Collibra DQ app. The % Completeness chart measures all the data, which shows around 90% complete in the following example. The Volume Weighted Completeness chart also measures the volume of the data, which shows around 97%.
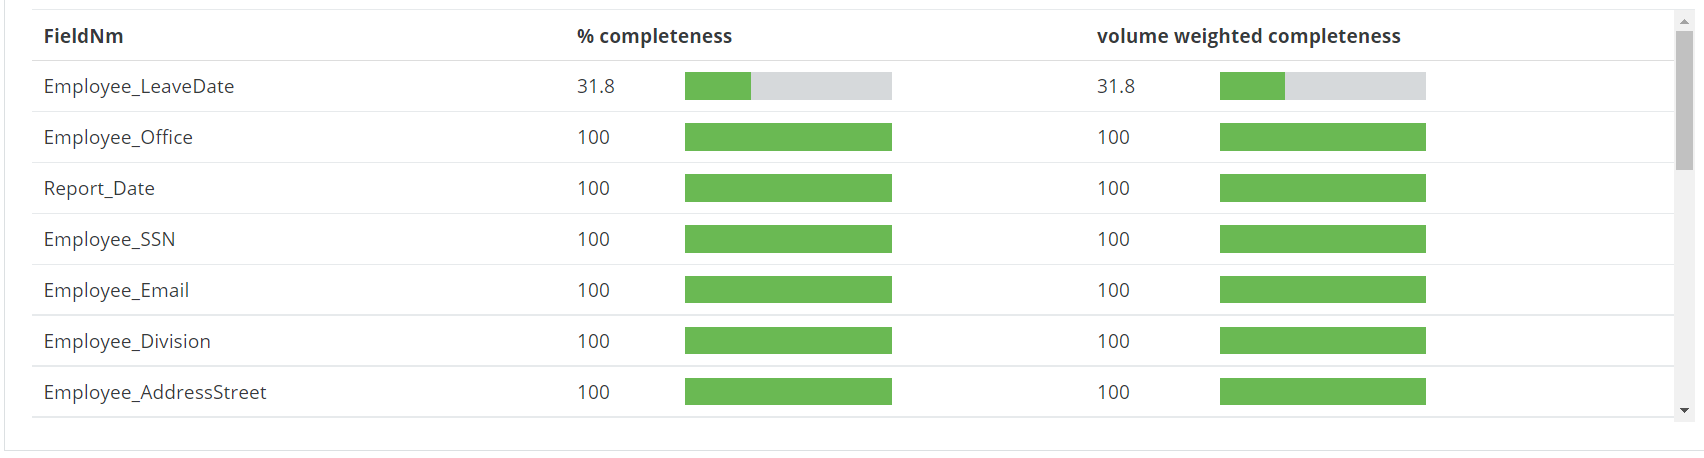
Column View
The column view shows the completeness of specific datasets, which makes it easy to see the columns that are least complete and, therefore, of possible concern. The columns range from 0% to 100% complete.
Volume Weighted Completeness and % Completeness example
To better understand how the Volume Weighted Completeness and % Completeness charts differ, consider the following example.
In the following table, there is a sample of customers who called the example company and created an issue with the support team.
| ID | Customer Name | Phone Number | Created on (date) |
|---|---|---|---|
| 1 | Noah | 123-456-7890 | 2024-01-01 |
| 2 | Oliver | 123-456-7891 | 2024-01-01 |
| 3 | Stephanie | 2024-01-02 | |
| 4 | Arturo | 2024-01-02 | |
| 5 | Lisa | 2024-01-02 | |
| 6 | Irene | 123-456-7892 | 2024-01-02 |
| 7 | Chidi | 123-456-7893 | 2024-01-02 |
| 8 | Miles | 123-456-7894 | 2024-01-02 |
If a scheduled job runs with the query select * from public.users where created_at = ${rd}, the completeness data for the column "Phone Number" will be:
| runId | Completeness % | Row Count (rc) |
|---|---|---|
| 2024-01-01 | 100 | 2 |
| 2024-01-02 | 50 | 6 |
The calculation of the Completeness % of the "Phone Number" column based on the above data is an average value:
Completeness = (100 + 50) / 2 = 75 ( % )
Whereas, the calculation of the Volume Weighted is a mean value:
Completeness weighted = (100 * 2 + 50 * 6) / (2 + 6) = 62.5 ( % )
Behavioral Analytics for Completeness
For a different approach to completeness management, see the Collibra DQ Behavior feature. This approach uses the data itself to create baselines and profiles to understand which completeness issues matter and, therefore, require you to take some kind of action.
To generate statistical process around completeness in the events you are most concerned about, and alert you to a change in slope (a drastic change in completeness), see the DQ Job Back Run and Profile features.