Collibra Data Quality Summary reports provide information about your datasets rolled up in high level summaries. These reports include the What is the Weekly Summary Report? and What is the Data Quality Checks Report?.
Note These reports provide a look at the most simplistic form of the rule. However, this view does not associate itself with a run's score.
What is the Weekly Summary Report?
When you operate a large data lake or several large data environments, it's helpful to have a way to report across different dimensions at an executive summary level. You may want to know the health or coverage per line of business, department or tenet, or per database.
Steps
To generate a Weekly Summary report, follow these steps.
-
Sign in to the Collibra DQ instance and click the
 Reports icon in the left navigation pane.
The Reports page opens. -
Select the Weekly Summary link.
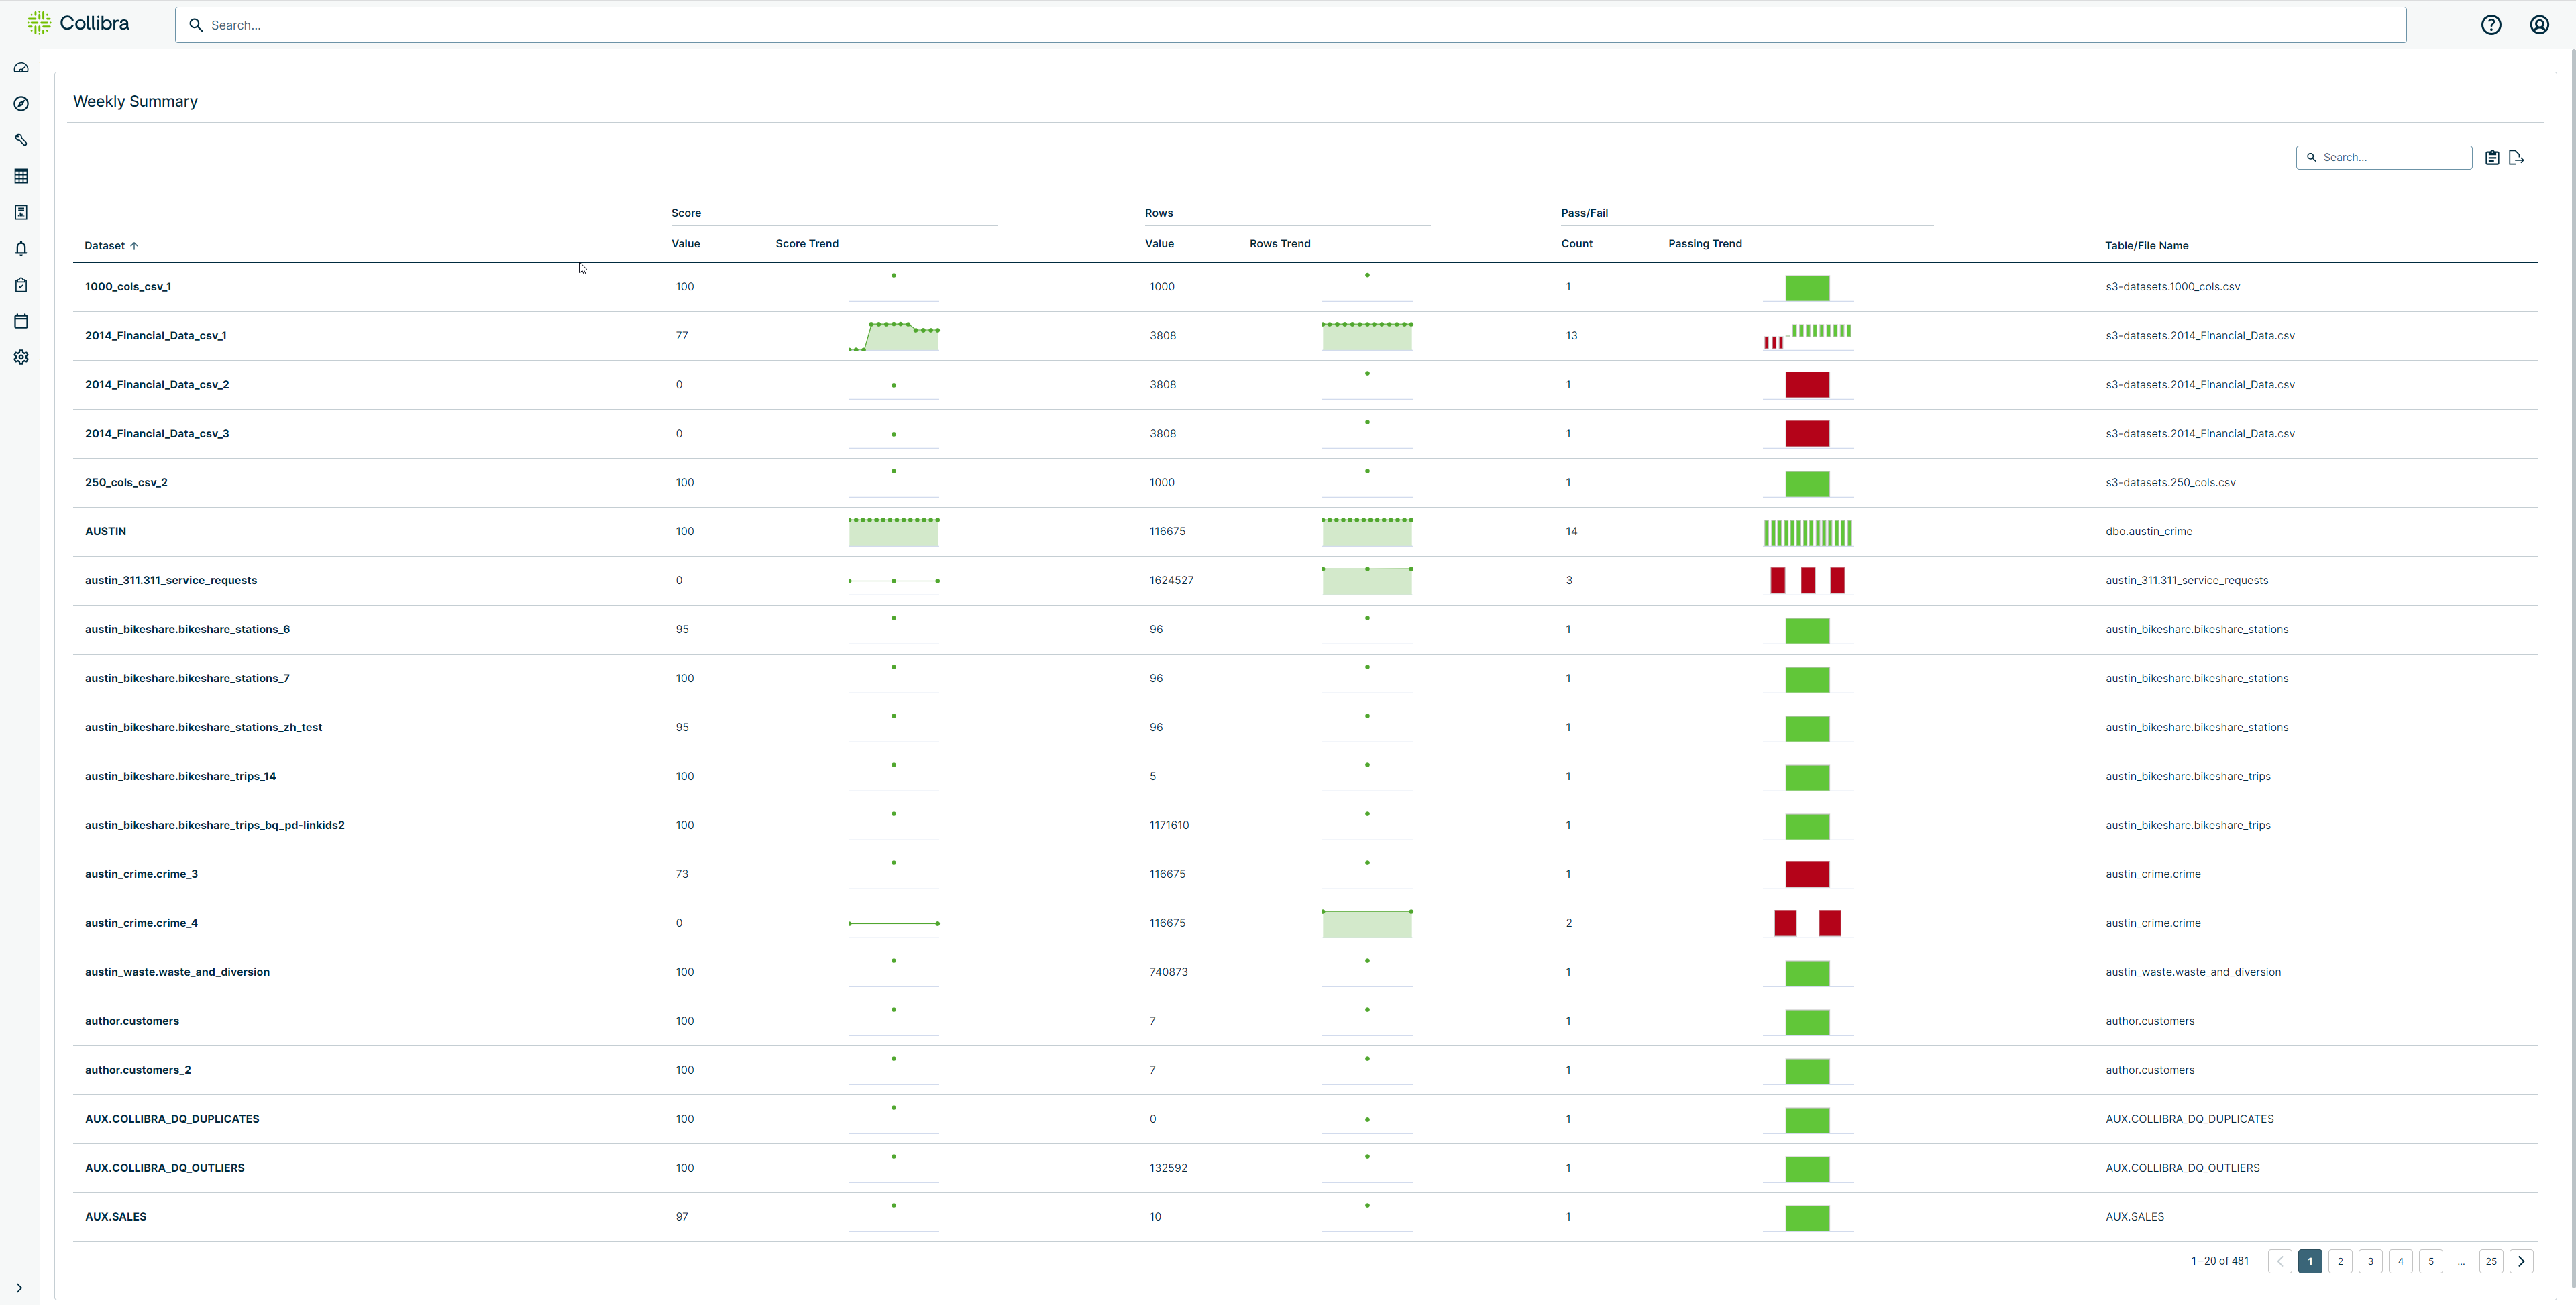
The Weekly Summary report displays.
The following table describes the report columns.
| Column | Description |
|---|---|
| Dataset | The datasets scanned over one week. |
| Score | The average data quality score of a dataset over one week. |
| Score Trend | A line graph representation of data quality scores over one week. Hover over the blue dots to see the score trend. |
| Rows | The total number of rows of a particular dataset scanned over one week. |
| Rows Trend | A line graph representation of row count over one week. Hover over the blue dots to see the rows trend. |
| Pass/Fail | Total number of DQ scans, whether they pass or fail. |
| Passing Trend | A histogram of DQ scans that passed (blue) or failed (red) over one week. Hover over the blue dots to see the passing trend. |
| Table/File Name |
The name of the table or file in use. |
-
Toggle the

 icons at the top of the column to sort the data that displays in the columns in ascending or descending order.
 -
Filter the report results by entering information in the search bar. For example, if you enter a number in the search field, any report result that includes that number displays.
- To make a copy of the reports, click the
 icon in the top right of the columns. The rows are copied to the clipboard.
 - To export the reports to CSV, Excel, PDF, and to print the reports, click the
 icon and select the desired option.
 -
Navigate the pages of your report by clicking the Previous and Next pagination buttons, located at the bottom of the columns.
What is the Data Quality Checks Report?
The Data Quality Checks Report provides a number of automatic checks of your datasets that are continually updated, based on observation and learning. This report includes the type of check performed and the check value and break value per dataset. The top portion of this report rolls up the highest results of the checks.
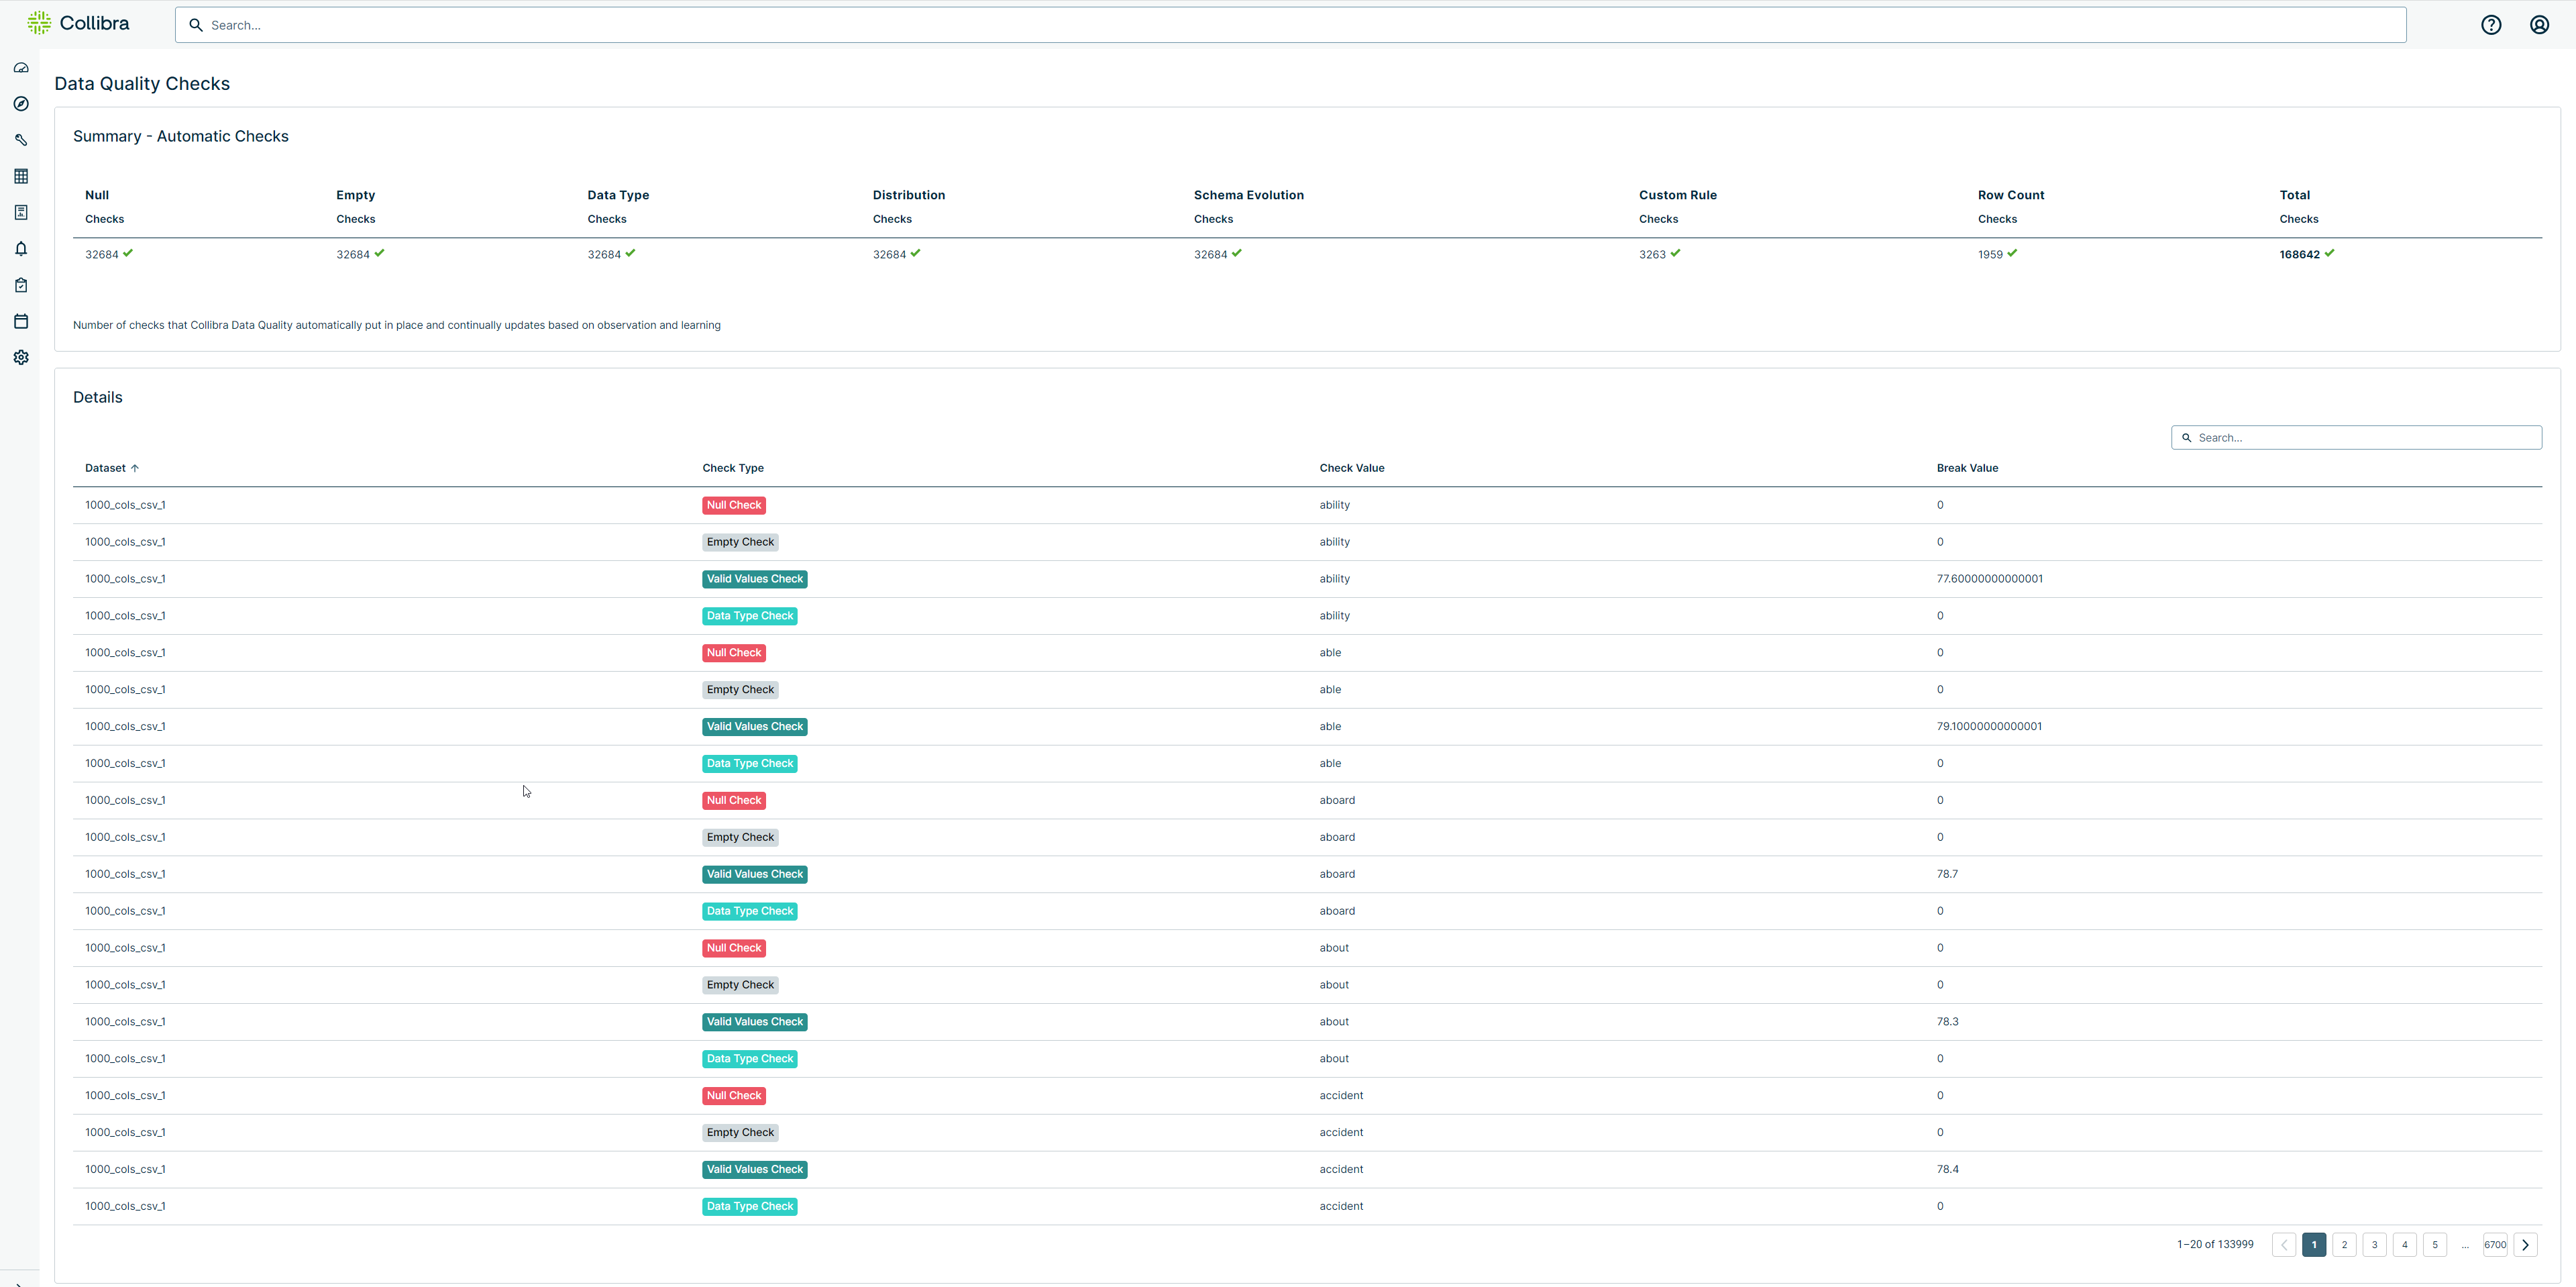
Note The Schema Evolution, located in the automatic checks summary at the top of the report, is a schema finding that shows how the schema has evolved from the last run.
Steps
To see the Data Quality Checks report, follow these steps.
-
Sign in to the Collibra DQ instance and click the
Reports icon in the left navigation pane.
The Reports page opens. -
Select the DQ Check Summary link.
The Data Quality Checks report displays.
This report includes a summary of the number of checks that Collibra DQ automatically ran at the top of the report and the details, which are described in the following table.
| Column | Description |
|---|---|
| Dataset | The name of the dataset. |
| Check Type | The type of check that DQ ran. |
| Check Value | The value associated with this check. |
| Break Value | The number of points associated with a rule break, which are then subtracted from a data quality score. |
-
Toggle the
icons at the top of the column to sort the data that displays in the columns in ascending or descending order. -
Filter the report results by entering information in the search bar. For example, if you enter a number in the search field, any report result that includes that number displays.
-
Navigate the pages of your report by clicking the Previous and Next pagination buttons, located at the bottom right of the columns.