The Collibra DQ web app tracks and stores the most recent key function web logs in a table, which is accessible via the Show Web Audit Logs button in the UI.
Note Currently, only the Explorer, Connections, and Rules web logs are tracked and displayed from the Show Web Audit Logs button.
Explorer Web Audit Logs
For the Explorer, Collibra DQ logs the queries that the Explorer runs for you as you proceed through the steps in the web app, as well as a limited scope of error messages. Specifically, the Explorer logs:
-
When you do a preview query.
-
Exceptions getting the database table preview.
-
When you run a query for a DQ Job estimate.
-
When you query to analyze data on the Explorer.
Connections Web Audit Logs
For Connections, Collibra DQ logs errors and success messages when attempting a connection.
Rules Web Audit Logs
For Rules, the web app only logs the SQL produced to get the DQ Job estimate.
Steps
-
Sign into Collibra DQ.
-
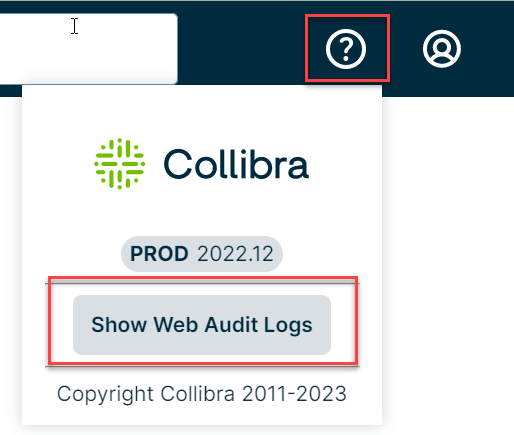
Click the
 Help icon in the top-right of the Home page.
 -
Click the Show Web Audit Logs button, as shown in the following screenshot.
A table displays the web audit trail logs of the key functions performed.
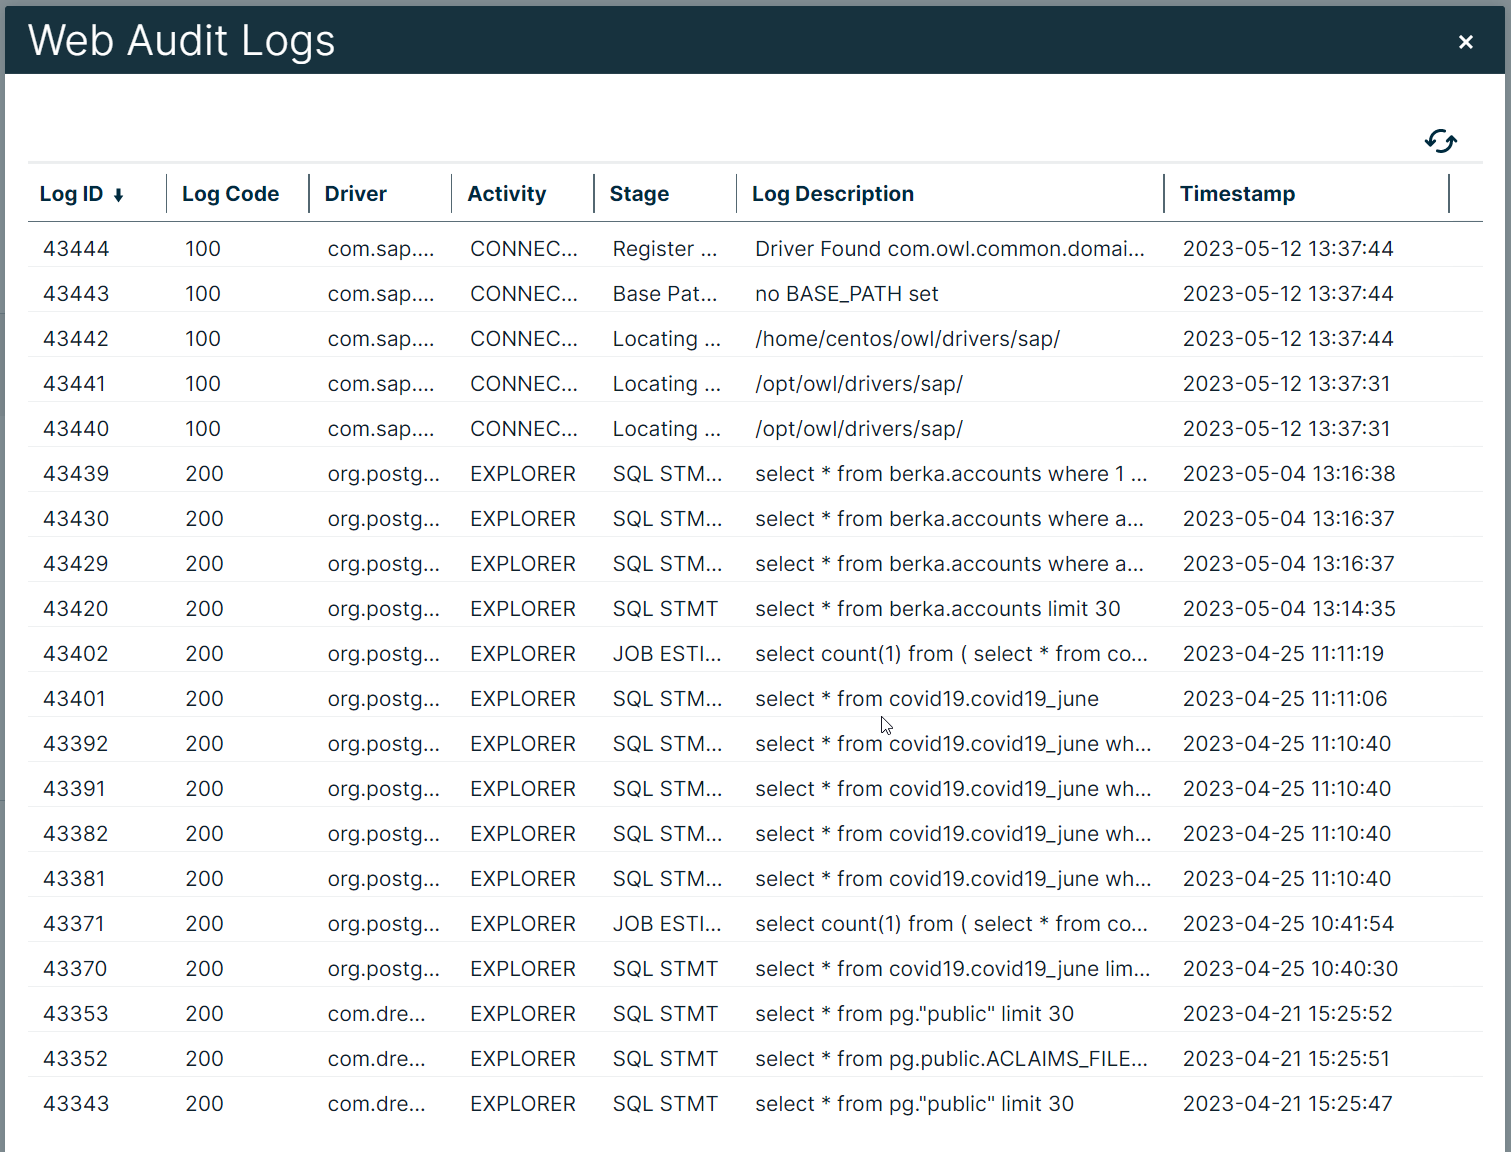
The columns in the table display the following elements.
| Column | Description |
|---|---|
| Log ID | Identification number of the log. |
| Log Code | Numeric code for the log. |
| Driver | Name of the driver. |
| Activity | Where the activity occurred. Options include Explorer, Connections, or Rule. |
| Stage | Stage of the activity for the log, for example, during a DQ Job estimate query. |
| Log Description | Column that describes the issue(s) in the log. |
| Timestamp | Time that the web audit log was created. |
Tip You can see the most recent web audit logs by clicking the ![]() refresh icon, at the top-right of the logs table.
refresh icon, at the top-right of the logs table.