Rule Summary
The Rule Summary page provides a list of rules and insightful donut chart views of rule details, rule breaks, and rule dimensions over a specific period of time. By understanding these details, you can better assess the amount of time and effort you spend writing and managing rules.
Use the Page dropdown menu to select a summary one of the following summaries, then select a Date Range:
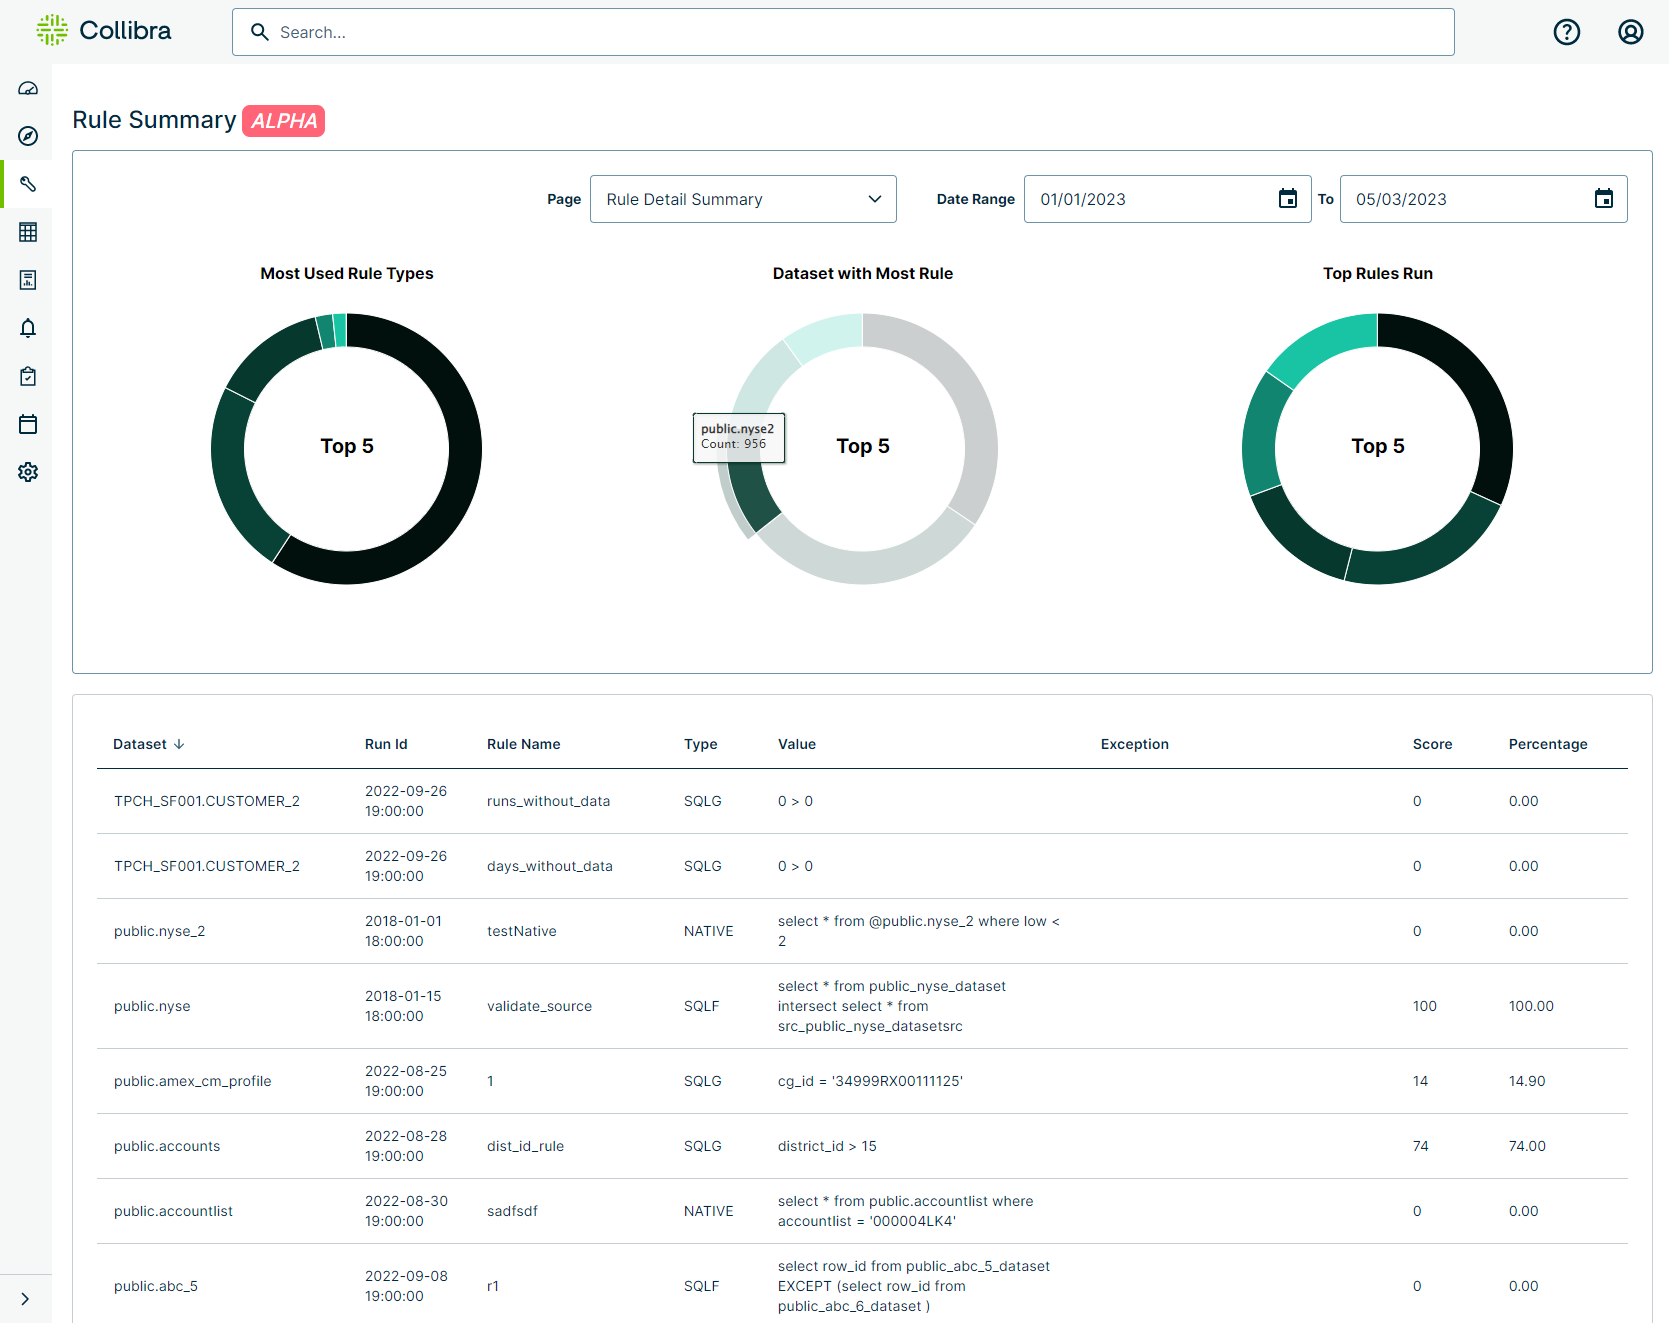
Rule Detail Summary
The Rule Detail Summary shows summaries of Top 5 rule values in three charts:
| Chart | Description |
|---|---|
| Most Used Rule Types | Shows the most frequently used rule types with details about the number of times they are used and the percentage of all rules for which a particular rule type accounts. Hover your cursor over the donut chart to view the details. |
| Datasets with Most Rules Written | Shows the datasets with the most rules Hover your cursor over the donut chart to view the details. |
| Top Rules Run | Shows the name of the rule and its count with the most runs in your environment. Hover your cursor over the donut chart to view the details. |
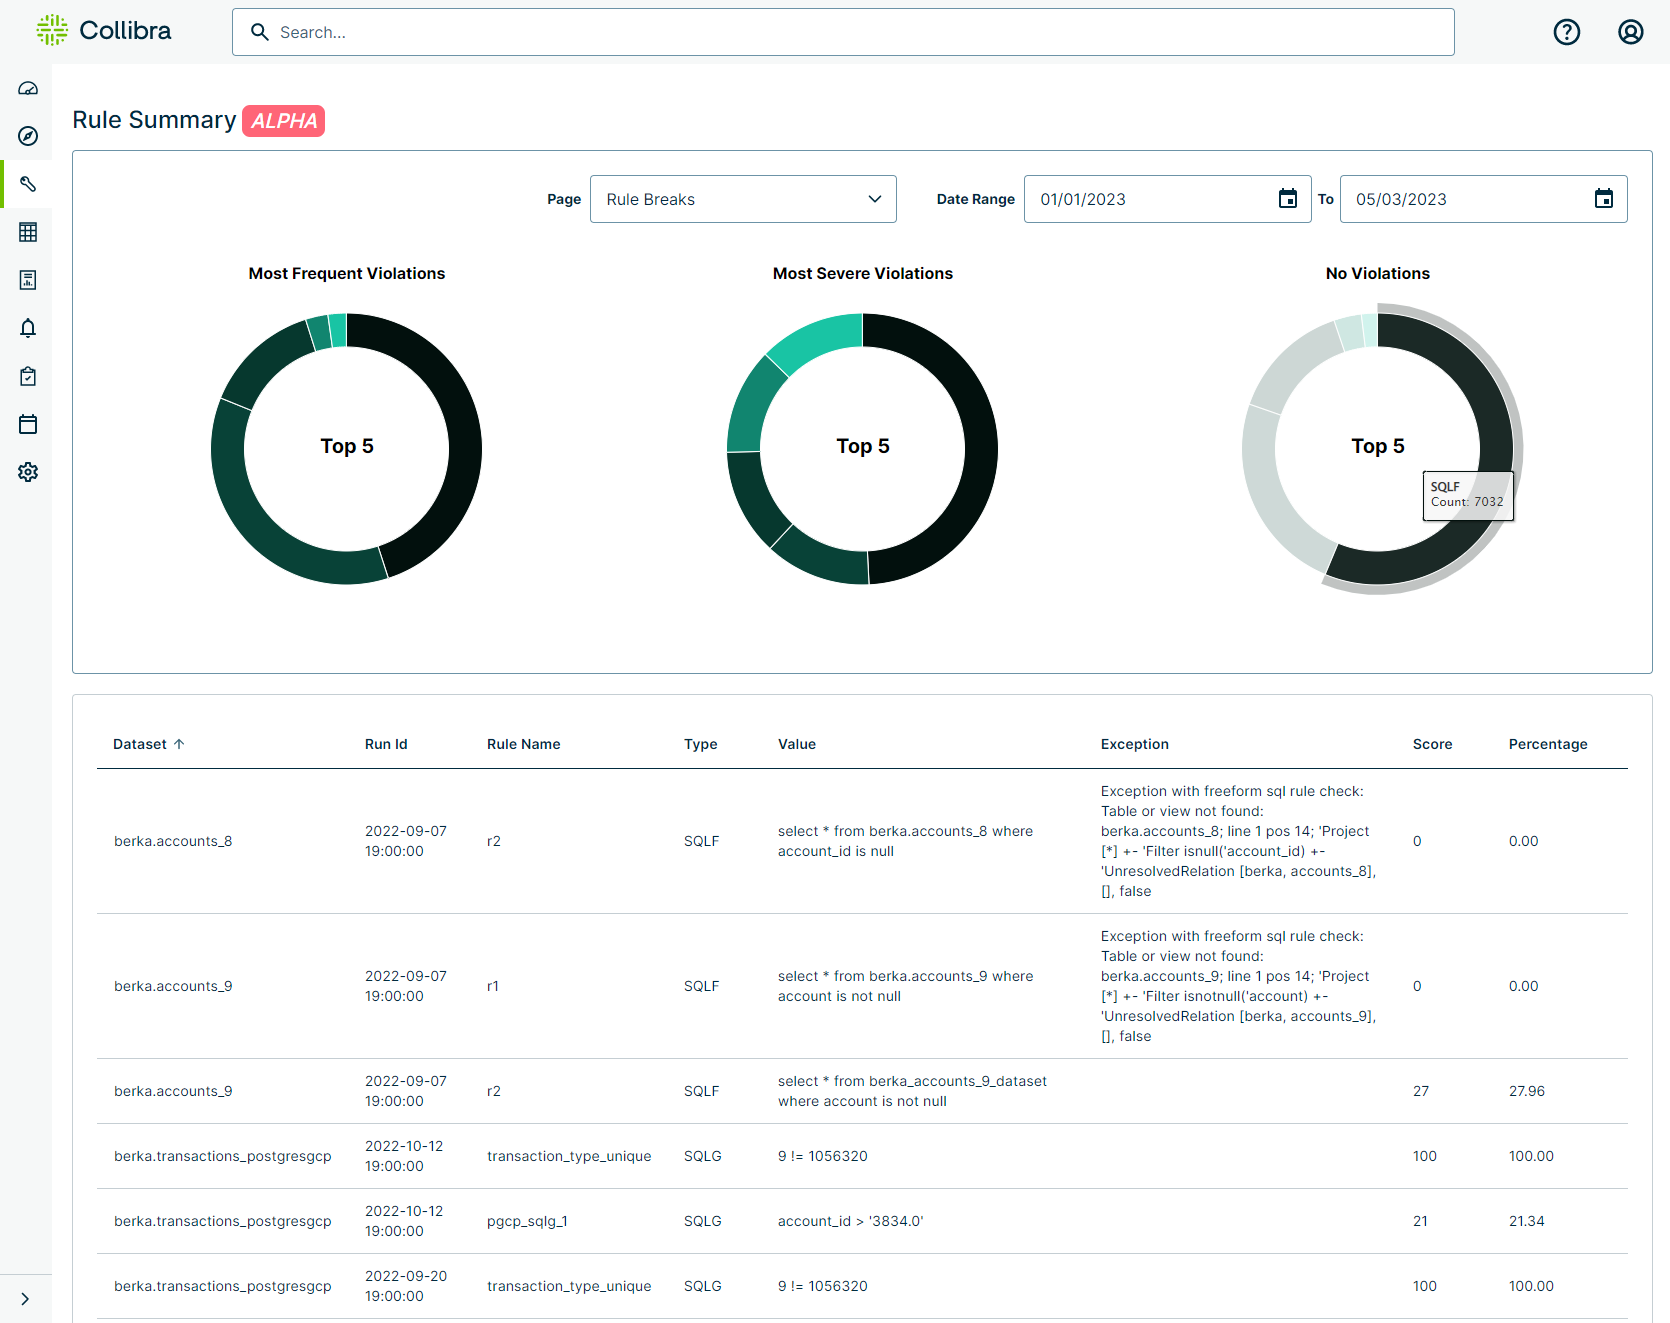
Rule Breaks
The Rule Breaks summary shows summaries of Top 5 rule break details in three charts:
| Chart | Description |
|---|---|
| Most Frequent Violation | Shows the rule types that most frequently violates its conditions. Hover your cursor over the donut chart to view the details. |
| Most Severe Violations | Shows the rule types with violations that result in the lowest scores in your environment. Hover your cursor over the donut chart to view the details. |
| No Violations | Shows the rule types with the fewest number of violating runs in your environment. For example, if SQLF rules run 7032 times without violation, and SQLF is the most frequently run rule in your environment, then it will appear as the largest section of the donut chart. Hover your cursor over the donut chart to view the details. |
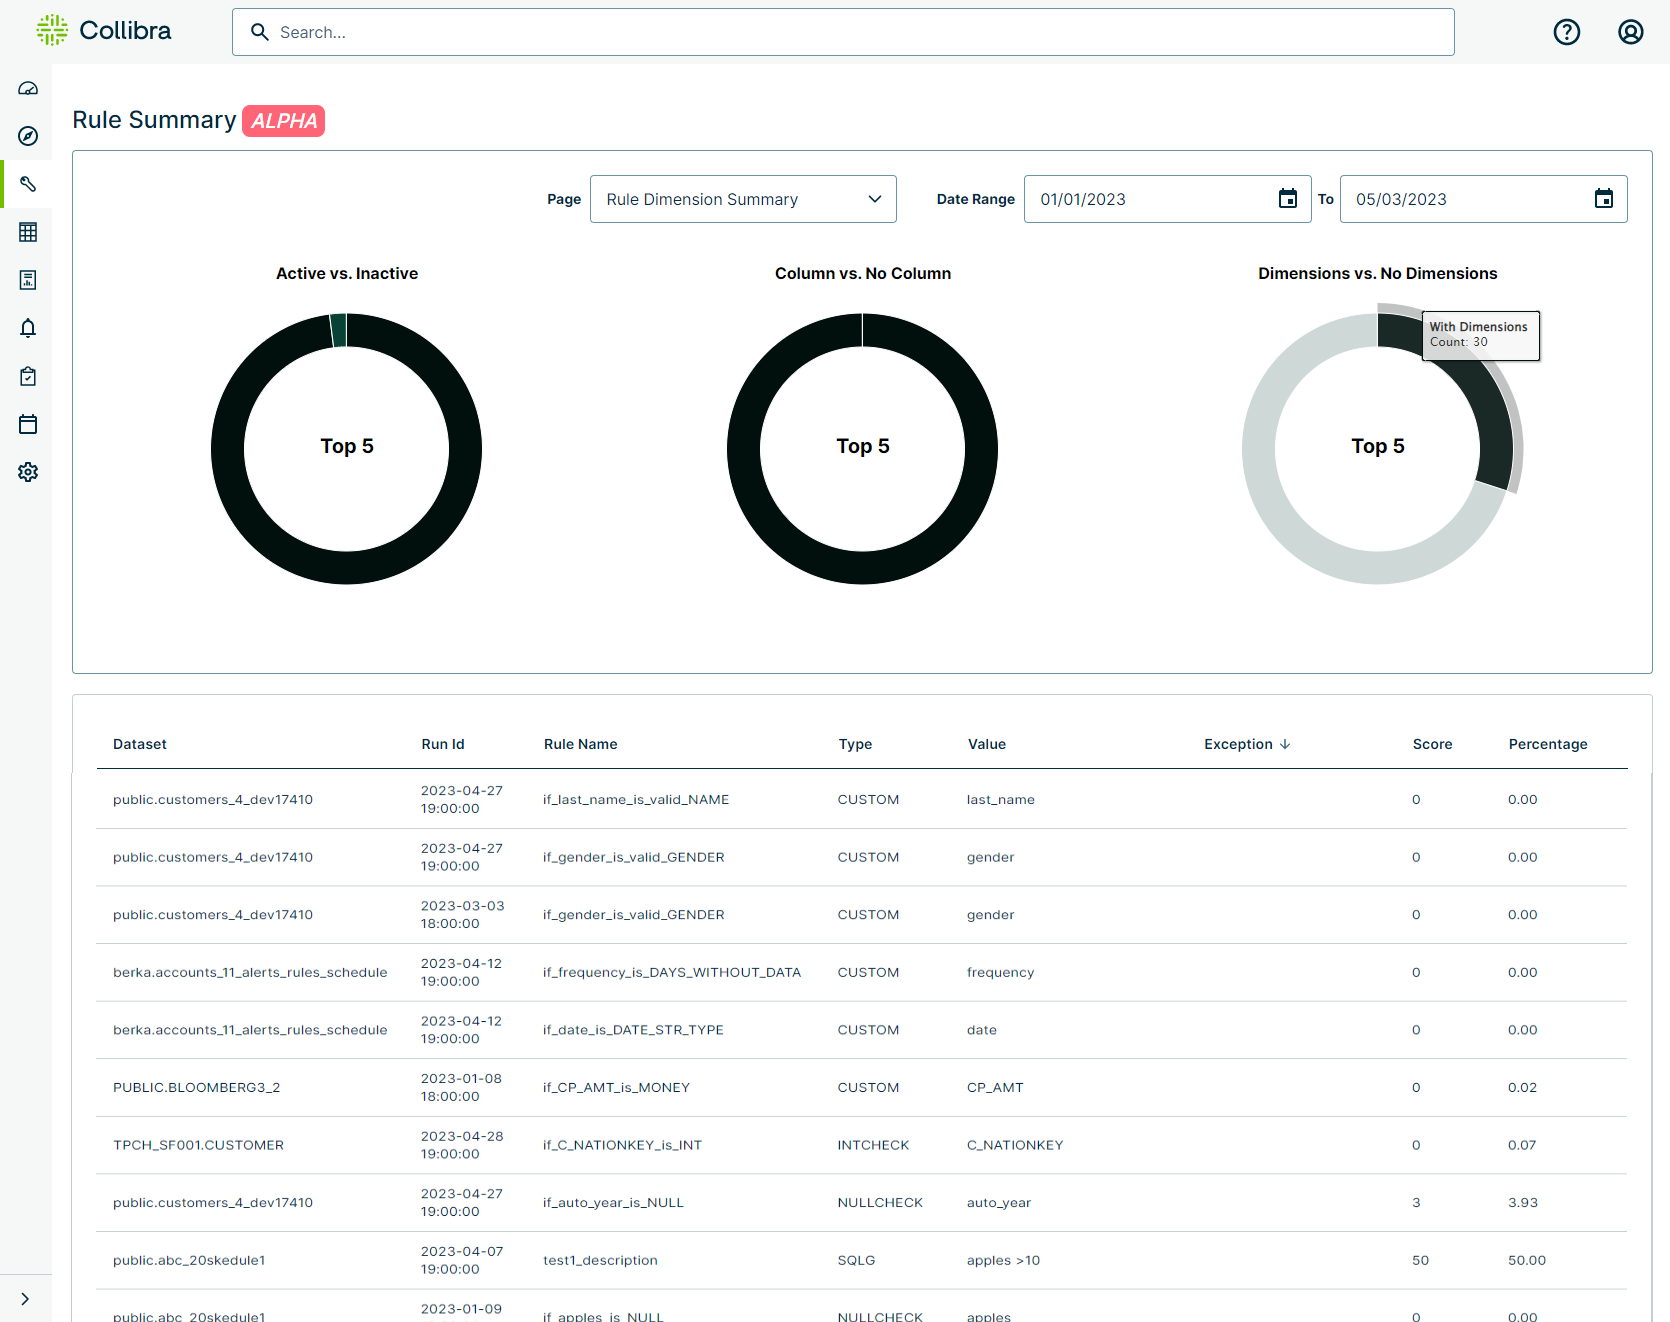
Rule Dimension Summary
The Rule Dimension Summary shows summaries of rule activity, rules with columns, and rules with dimensions in three charts:
| Chart | Description |
|---|---|
| Active vs. Inactive | Shows the number of active and inactive rules on all of your datasets over a period of time. Hover your cursor over the donut chart to view the details. |
| Column vs No Column | Shows the number of rules with columns. Hover your cursor over the donut chart to view the details. |
| Dimensions vs. No Dimensions | Shows the number of rules that are and are not associated with a DQ Dimension. Hover your cursor over the donut chart to view the details. |