The Pulse View provides a snapshot of DQ jobs that were executed, whether manually or on a schedule. On the Pulse View dashboard, you can view heat maps of the health of your jobs, and filter by the following criteria:
- Business Unit
- Connections
- User
- Last X Days
- Mode
- Schedule
- Failed Runs
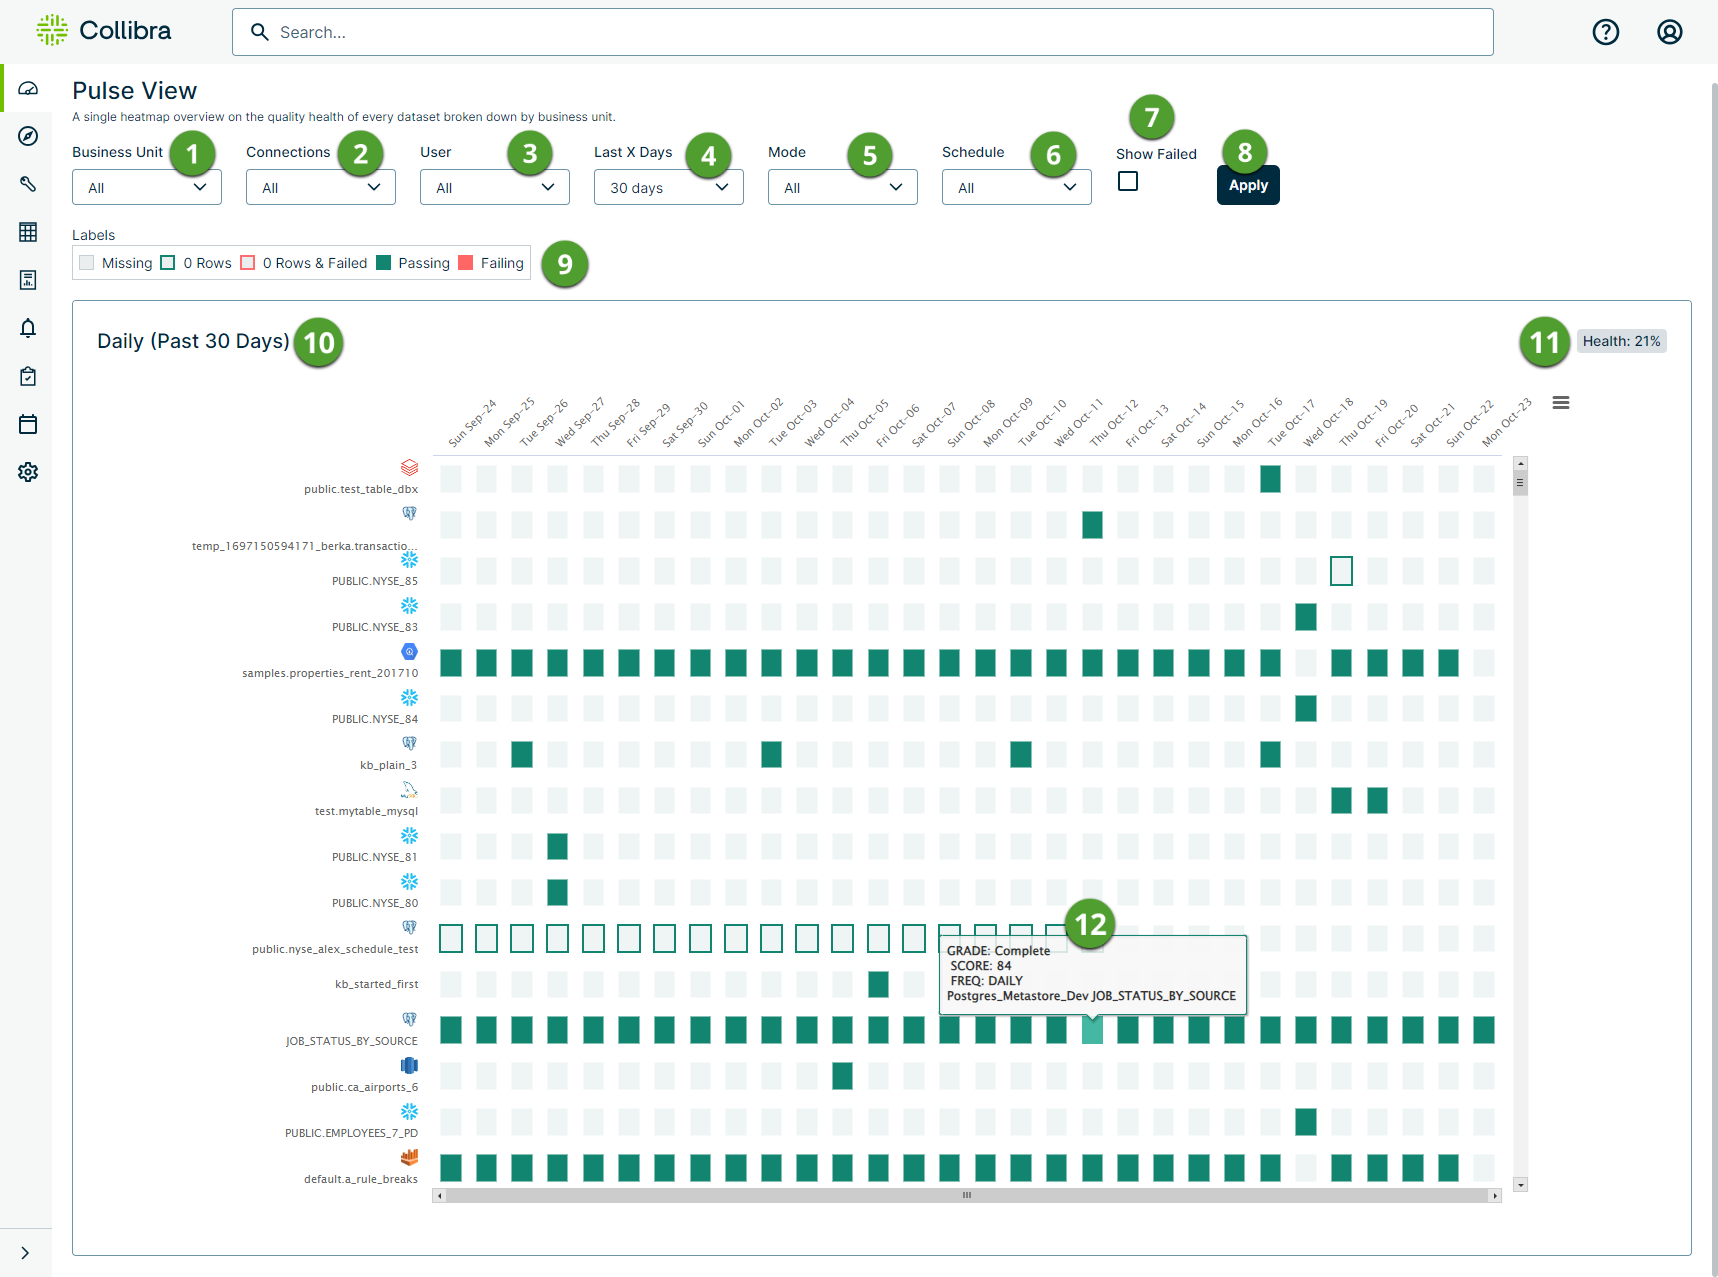
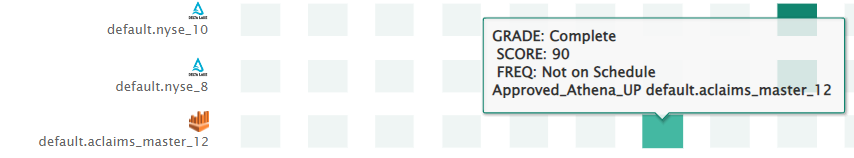
The following screenshot shows an example of the type of data you can view when you hover your cursor over a heat map label, for example, a grade, score, and scheduled frequency.
| Number | Element | Description | ||||||||||||||||||
|---|---|---|---|---|---|---|---|---|---|---|---|---|---|---|---|---|---|---|---|---|

|
Business Unit |
Filter by business unit. |
||||||||||||||||||

|
Connections | Filter by connection name. | ||||||||||||||||||

|
User | Filter by username. | ||||||||||||||||||

|
Last X Days | Filter by the last 9, 14, 30, or 60 days. | ||||||||||||||||||

|
Mode | Filter by draft, published, or all modes. | ||||||||||||||||||

|
Schedule | Filter by jobs scheduled to run daily, monthly, or display all. | ||||||||||||||||||

|
Show Failed | When you select this check box, only the runs that failed display. When this option is not selected, every job that ran displays, whether the score was passing or failing. | ||||||||||||||||||

|
Apply | Applies your selected filters to the heat map. | ||||||||||||||||||

|
Labels |
|
||||||||||||||||||

|
Pulse view heat map | A heat map of all the datasets in your environment and their run details. | ||||||||||||||||||

|
Health | A composite score of the health of dataset runs in your environment. | ||||||||||||||||||

|
Run information | Hover your cursor over a specific run on the heat map to show its grade, score, scheduled frequency, and the name of the dataset. |