The Change Detection modal appears when you click the Actions  button. Select either Adaptive, Manual, or Suppress from the options below to see details about each alert type.
Note If you change an Adaptive Rule from Manual to Adaptive, you need to retrain your dataset by clicking Retrain on the Behavior tab of the Findings page.
- Adaptive
- Manual
- Suppress
| Adaptive Level | Description |
|---|---|
| Strict |
Rigidly enforce and alert of any data points that fall outside what Collibra DQ's behavioral model learns to be normal. Any values outside the strict boundaries will be flagged as potential data quality issues. |
| Neutral/System Detected | Automatically enforce and alert any data points that fall outside what Collibra DQ's behavioral model learns to be normal. Any values outside the neutral boundaries will be flagged as potential data quality issues. |
| Lenient |
Relax the enforcement and alerting when data points fall outside of the range that Collibra DQ's behavioral model learns to be normal. Any values outside the lenient boundaries will be flagged as potential data quality issues. Tip This can help avoid excessive alerts when Collibra DQ is in the learning phase of a new dataset. |
| Pass Value on [Date] | Select this option to accept the value from a given date into the rolling behavioral baseline. |
Adaptive level calculations
The adaptive level calculations vary depending on the specific type of data quality check being performed. The table below shows the check type, the thresholds of the three adaptive levels in relation to the check type, and the areas each check type impacts.
| Adaptive level | Threshold | Impacts |
|---|---|---|
| Cardinality (Standard Deviation) | ||
| Strict |
Cardinality standard deviation threshold (ABS): 2.1 Cardinality standard deviation min/max threshold (z-score for min/max drift): 3.1 |
|
| Neutral/System Detected |
Cardinality standard deviation threshold (ABS threshold): 2.5 Cardinality standard deviation min/max threshold (z-score for min/max drift): 3.4 |
|
| Lenient |
Cardinality standard deviation threshold (ABS threshold): 3.9 Cardinality standard deviation min/max threshold (z-score for min/max drift): 6.1 |
|
| Cardinality (Percent Change) | ||
| Strict | Cardinality percent change threshold: 11% |
|
| Neutral/System Detected | Cardinality percent change threshold: 14% | |
| Lenient | Cardinality percent change threshold: 45% | |
| Min/Max (Standard Deviation) | ||
| Strict | Min/max standard deviation threshold (z-score for min/max drift): 3.1 |
|
| Neutral/System Detected | Min/max standard deviation threshold (z-score for min/max drift): 3.4 | |
| Lenient | Min/max standard deviation threshold (z-score for min/max drift): 6.1 | |
| Min/Max (Percent Change) | ||
| Strict | Min/max percent change threshold: 12% |
|
| Neutral/System Detected | Min/max percent change threshold: 18% | |
| Lenient | Min/max percent change threshold: 65% | |
| Standard Deviation Threshold (Deviation from the baseline) | ||
| Strict | Standard deviation threshold: 2.3 |
|
| Neutral/System Detected | Standard deviation threshold: 2.8 | |
| Lenient | Standard deviation threshold (null, empty): 3.5 | |
| Percent Change Threshold | ||
| Strict | Percent change threshold: 3% |
|
| Neutral/System Detected | Percent change threshold: 8% | |
| Lenient | Percent change threshold: 40% | |
| Option | Description |
|---|---|
| Lower Bound | Alerts when Collibra DQ discovers data in the selected column lower than the limit you set for the Adaptive Rule. |
| Upper Bound | Alerts when Collibra DQ discovers data in the selected column higher than the limit you set for the Adaptive Rule. |
| pt(s) |
The number of points to deduct from the data quality score for a given finding. This relates to the percent change and Z-score when the Z-score ranges from 0.0-6.0. |
Turns off alerts for unique findings in the selected column.
Change Detection chart
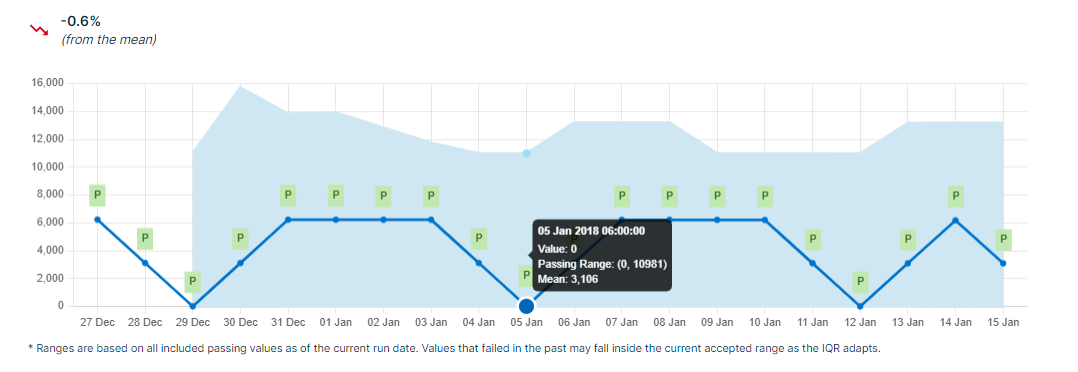
The Change Detection line chart shows the range of all passing, failing, and inactive values between the current run date and 20 runs in the past. You can hover your cursor over any available day to view important statistics for that run.
Previous and current TopN/BottomN Values charts
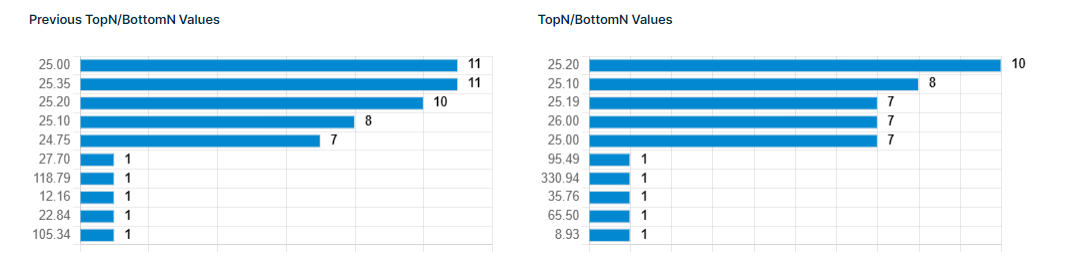
The previous and current TopN/BottomN Values charts show the row values that appeared the most and least frequently and satisfy the condition of the Adaptive Rule in the column of reference. In the above example, the Adaptive Rule is a Unique Range check on the "high" column where the condition is high.$uniqueCount NOT BETWEEN 739.9 AND 6963.0. Therefore, the values that appear the most and least frequently and are either greater than 6963.0 or less than 739.9 are considered the TopN and BottomN values.
Indeed, in the above screenshot, the TopN row values of the previous run in the chart on the left were 25.00 and 25.35, which both appeared 11 times. The BottomN values were 27.70, 118.79, 12.16, 11.84, and 105.34, which all appeared only once for that run. On the chart to the right, the TopN value from the current run is 25.20 with 10 occurrences, while the BottomN values are 95.49, 330.94, 35.76, 65.50, and 8.93 with one occurrence apiece.