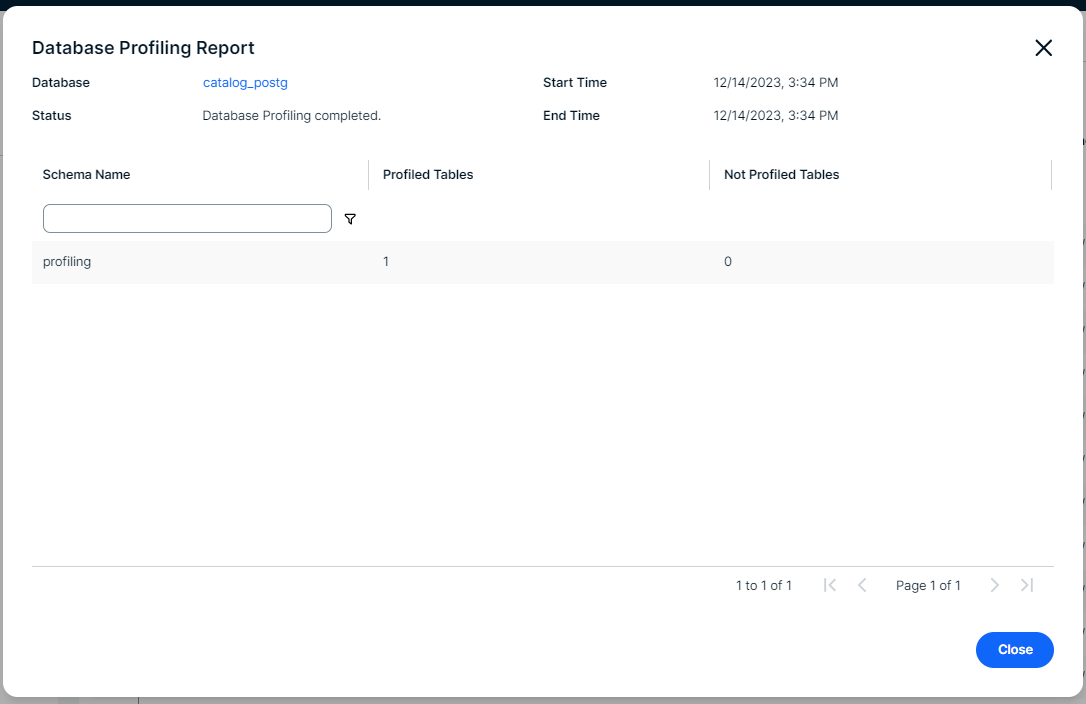
In Collibra 2024.02, we've launched a new user interface (UI) in beta for Collibra Data Intelligence Platform! You can learn more about this latest UI in the UI overview.
Use the following options to see the documentation in the latest UI or in the previous, classic UI:
When you profiled and classified a data source via Edge, and you click the Result button of the profiling and classification activity, the Database profiling result dialog box opens.
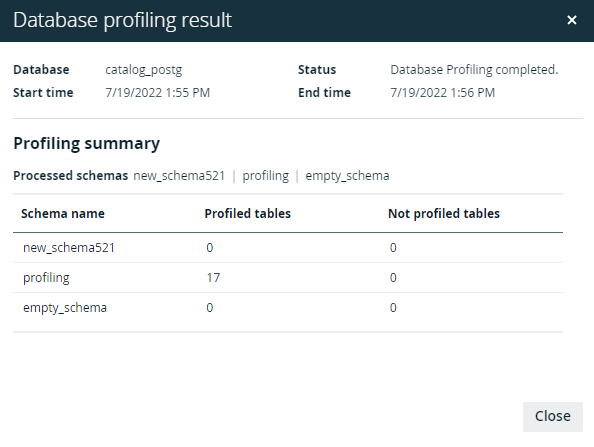
The following information is available:
| Item | Description |
|---|---|
| Database | Name of the database as added to Collibra Data Intelligence Platform. |
| Status | Status of the data source profiling and classification job. |
| Start time | Date and time when the profiling and classification job started. |
| End time | Date and time when the profiling and classification job was completed. |
| Profiling Summary |
The names of the schemas that have been profiled and classified. For each schema, you find information on:
|
The profiling and classification results are available in the asset pages. See Data profiling information.