Our Approach
Because: Using raw data to drive key decisions, leads to incorrect answers and end-user distrust.
Collibra Data Quality is singularly focused on providing your end-users with the highest standards of data quality. We are purpose-built to solve the problem of data quality and to ensure end-user trust.
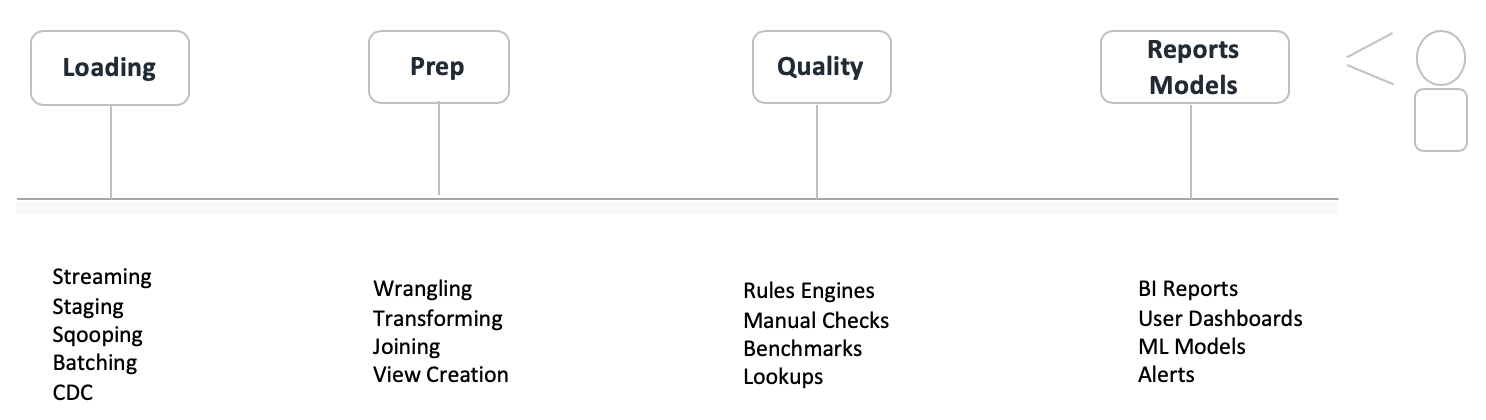
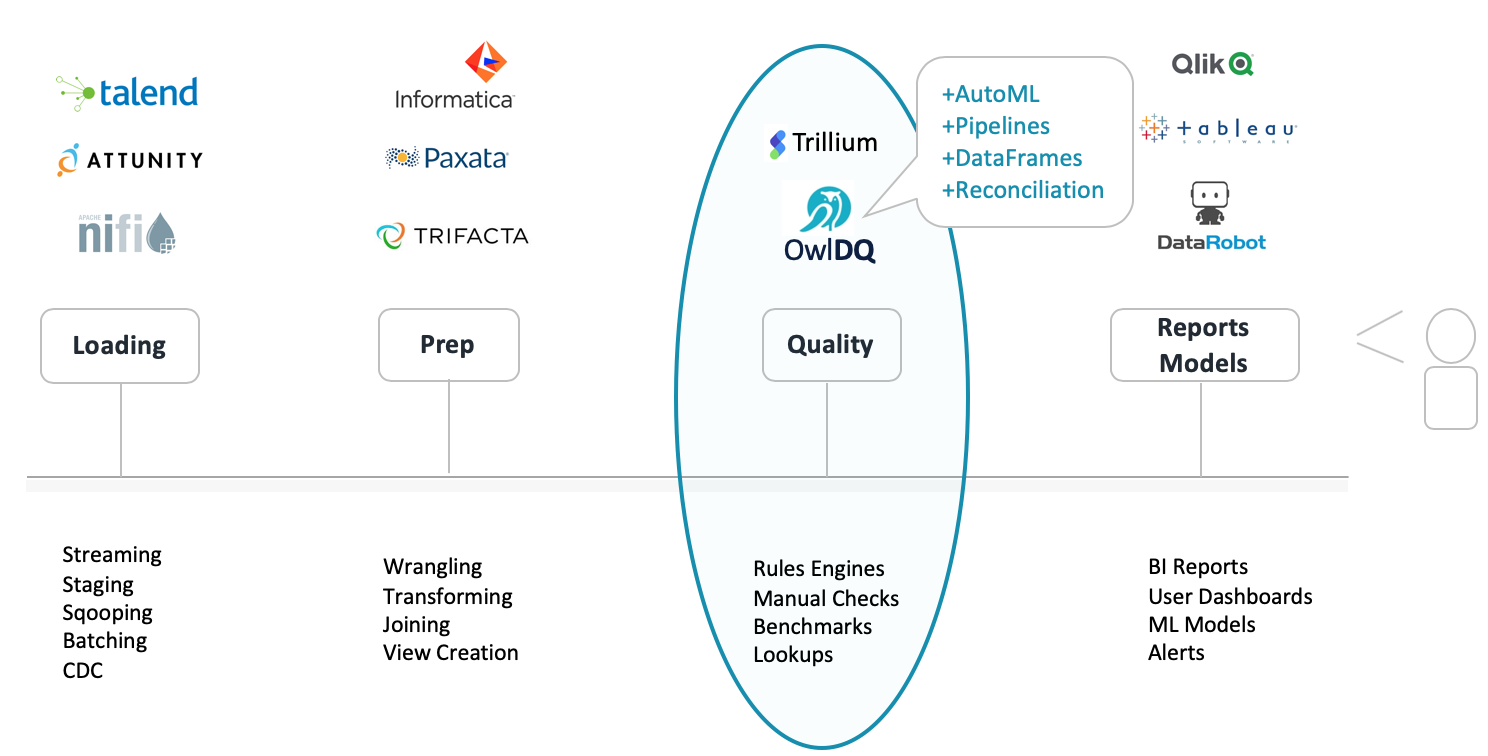
To avoid getting lost in the latest marketing jargon, a fundamental description is provided under each of the four stages. There are many ways to ingest and transform data; the descriptions are not meant to be exhaustive. Imagine a scenario where data is loaded in either a batch or stream, then joined to another dataset with some column transformations, and finally made viewable in a BI tool for consumption. But what about quality? What checks and verifications are in place to guarantee data accuracy and completeness? After all, showing someone a housing report with incorrect estimated housing values or a stock report with the wrong stock prices won’t go over well. Figure 2 below shows popular company logos overlaid in each stage to bring more context to the discussion. There are easily 30+ software companies in each of the four stages, DQ chose three popular companies in each sector at random. DQ is not ranking companies. Gartner is of course an obvious choice if you are looking for companies rankings per sector.
So, What’s the Problem?
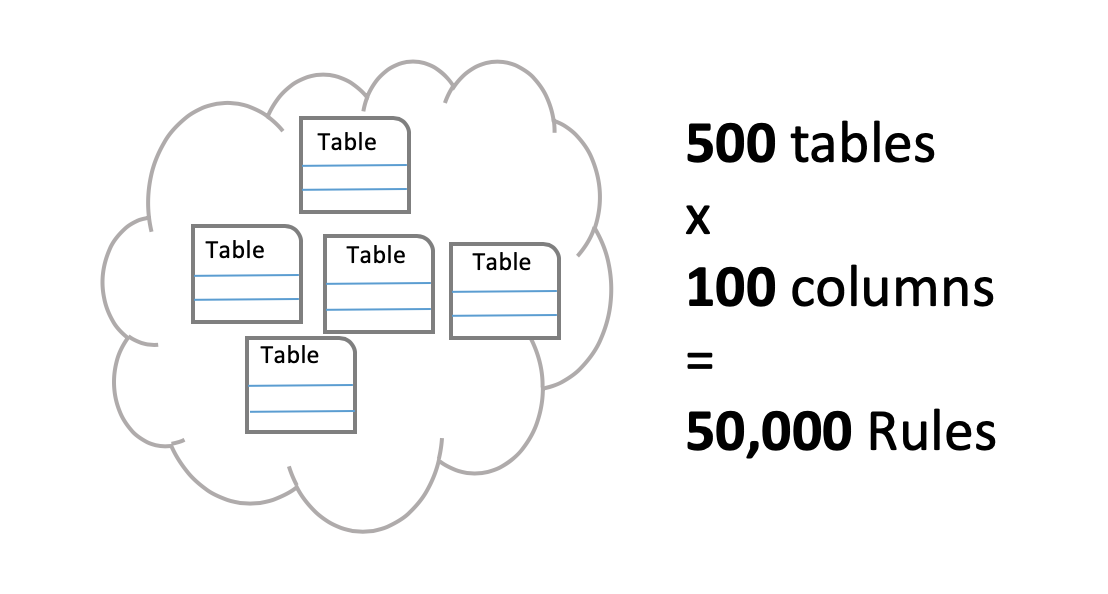
Detecting data issues is nuanced, manual and time consuming. The traditional solution is to write bespoke code or use a rules engine to validate specific columns in a data set. If missing data is a concern, a common remedy is to write a nullcheck. Another common example is a row count check; a piece of logic that checks if the number of rows in a data set is greater than a specified number. Of course, DQ and business rules can get much more complicated. Scale becomes a huge issue, because it is nearly impossible to write all the rules that a business truly needs to be confident in their data. Often times, the math is f(x) = columns * dbTables. 100 columns on average and 500 tables in a single warehouse equals 50,000 rules if you only wrote 1 rule per column. The reality is you need many rules per column, and your business has more than 500 tables and files. But there are even bigger problems with this strategy. Rules are a reactive approach to solving the problem; they are manually written and don’t adapt (they are static). With a rules-only approach, you can measure your franchise risk by the number of rules you can write. This requires coders, domain experts and a tool to write and then manage the rules.
How Can Predictive DQ Help?
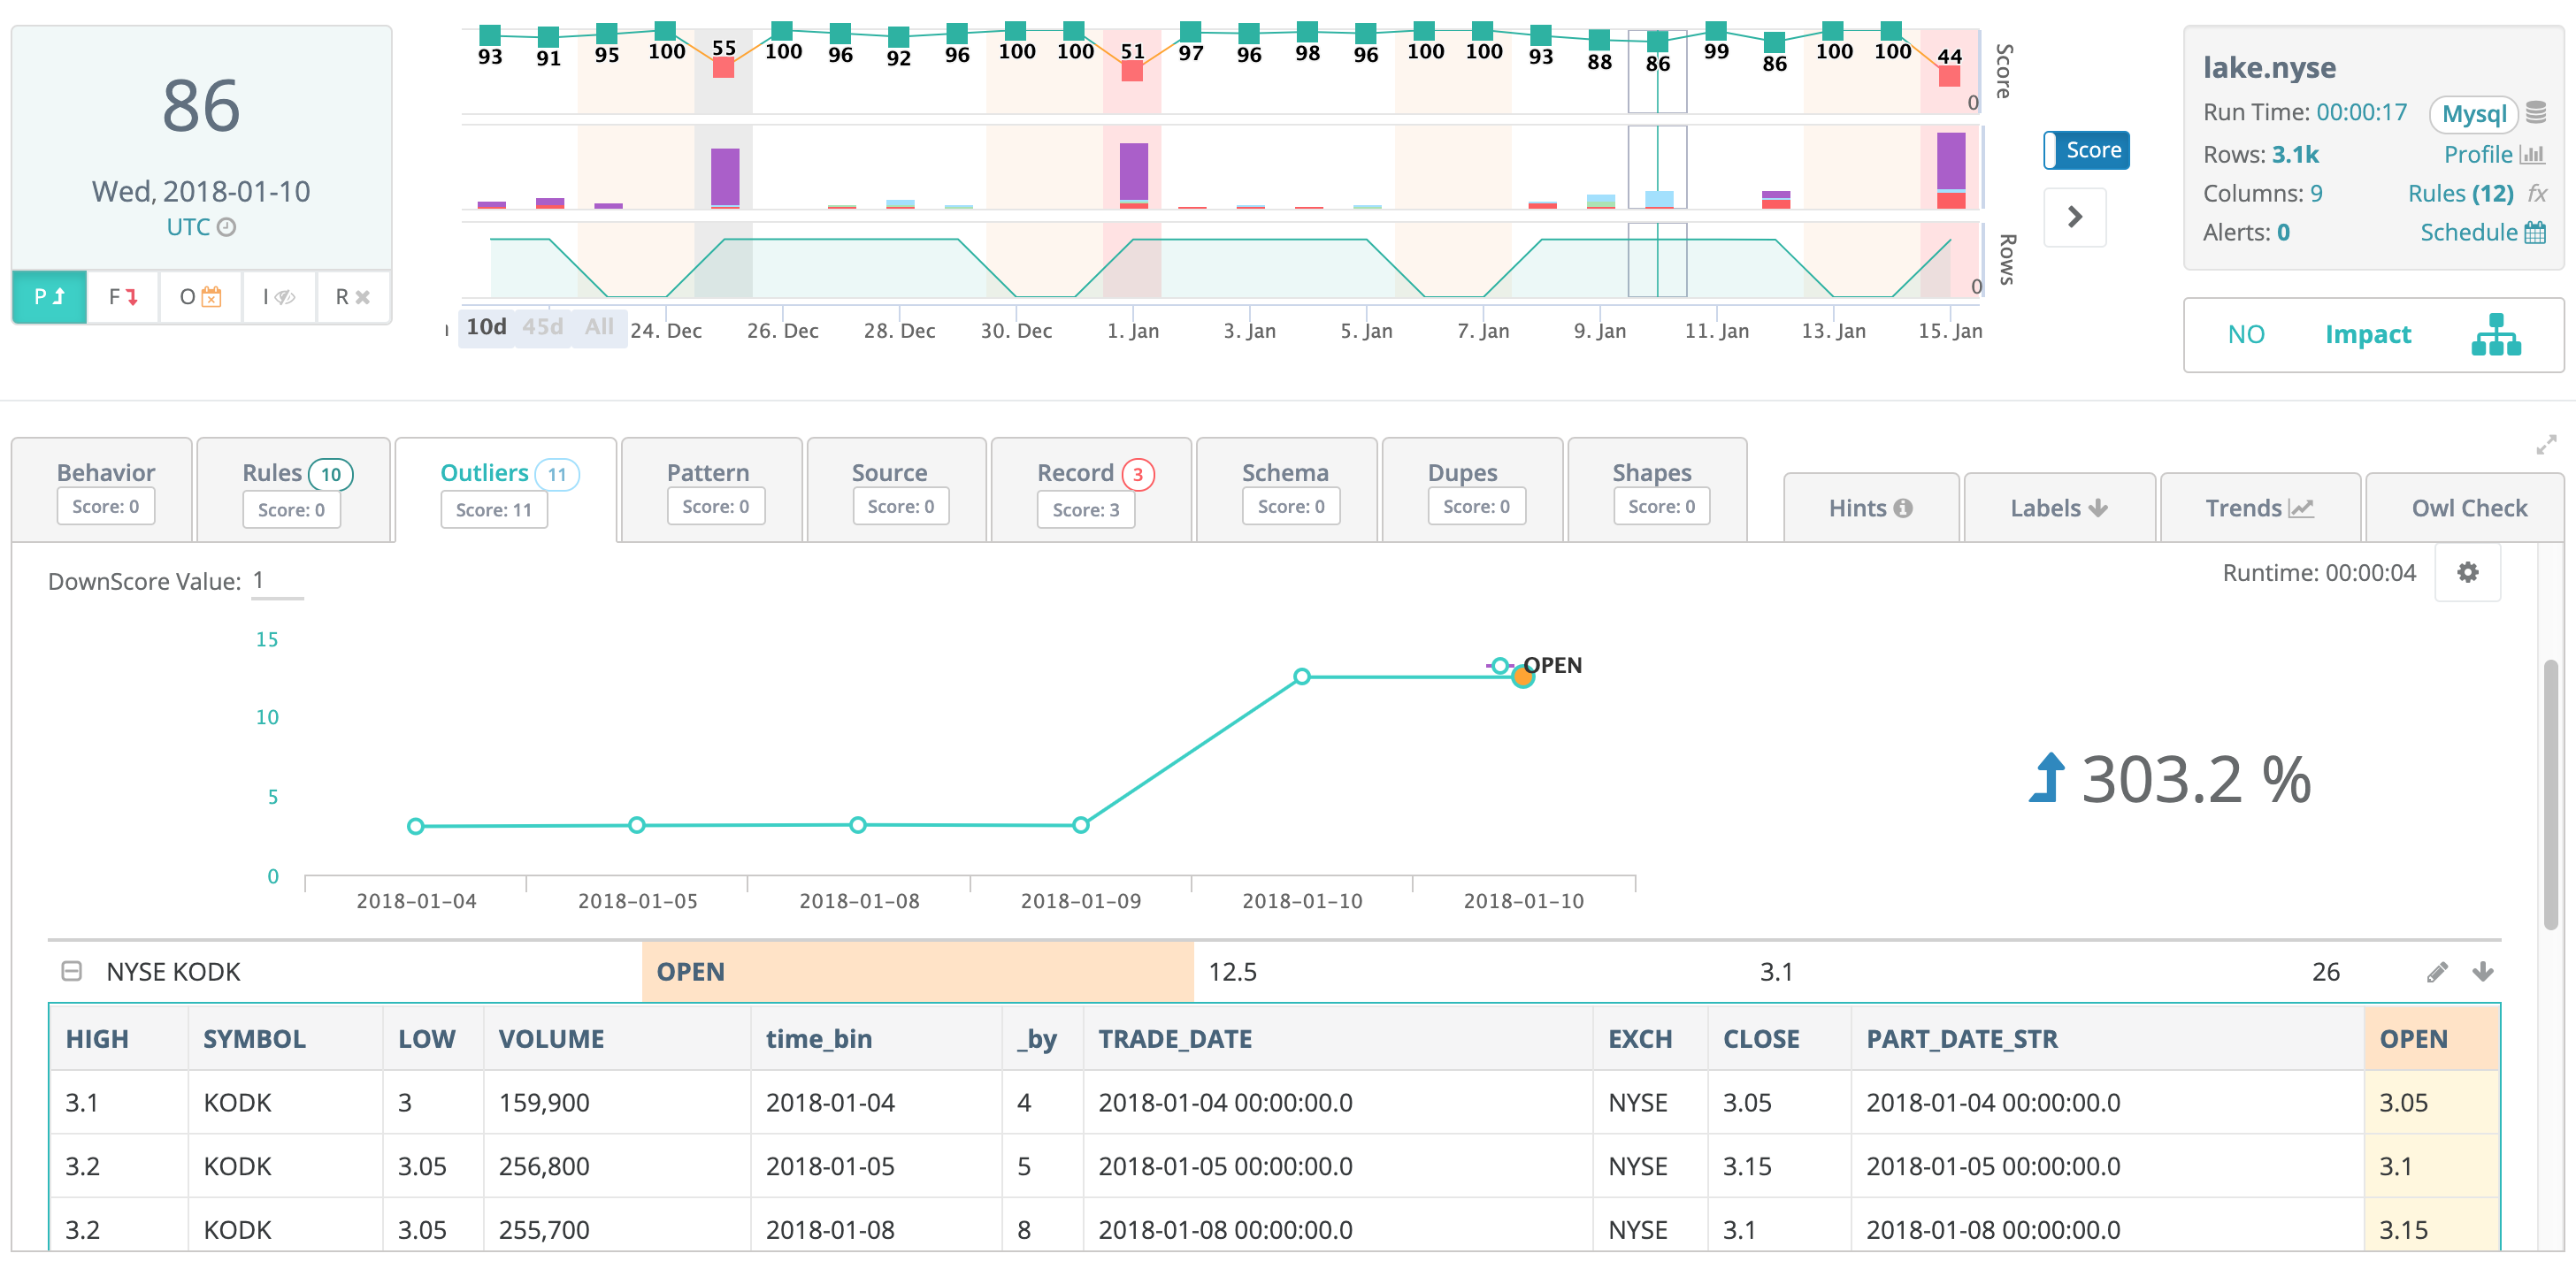
DQ intentionally solves the problem using a machine learning first, rules second based approach. DQ automatically puts all columns under quality control. This includes nullchecks, emptychecks, statistical profiles, and sketches. DQ creates snapshots and baselines to benchmark past data and discover drift. DQ automatically creates an ML labeling system for users to collaborate and down-train items with a click of a button. The reason for this approach is to maximize coverage while reducing the dependency of manual rule building. The greater technical benefit is that all of DQ's generated checks and rules are adaptive. DQ is constantly learning from new data and will make predictions in many cases for typos, formatting issues, outliers and relationships. This is a paradigm shift from, risk being a measure of how many rules one can dream up and write, to simply click the DQ [RUN] button.
Why a Unified DQ Solution?
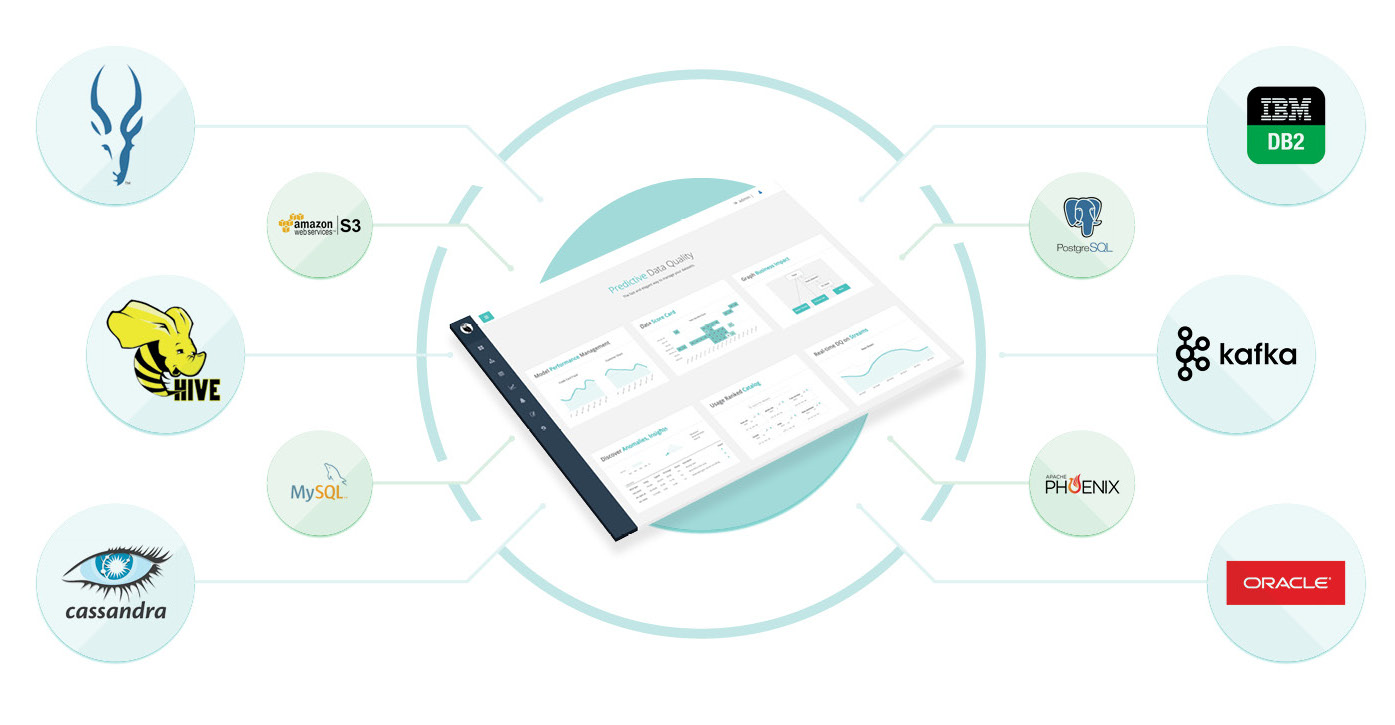
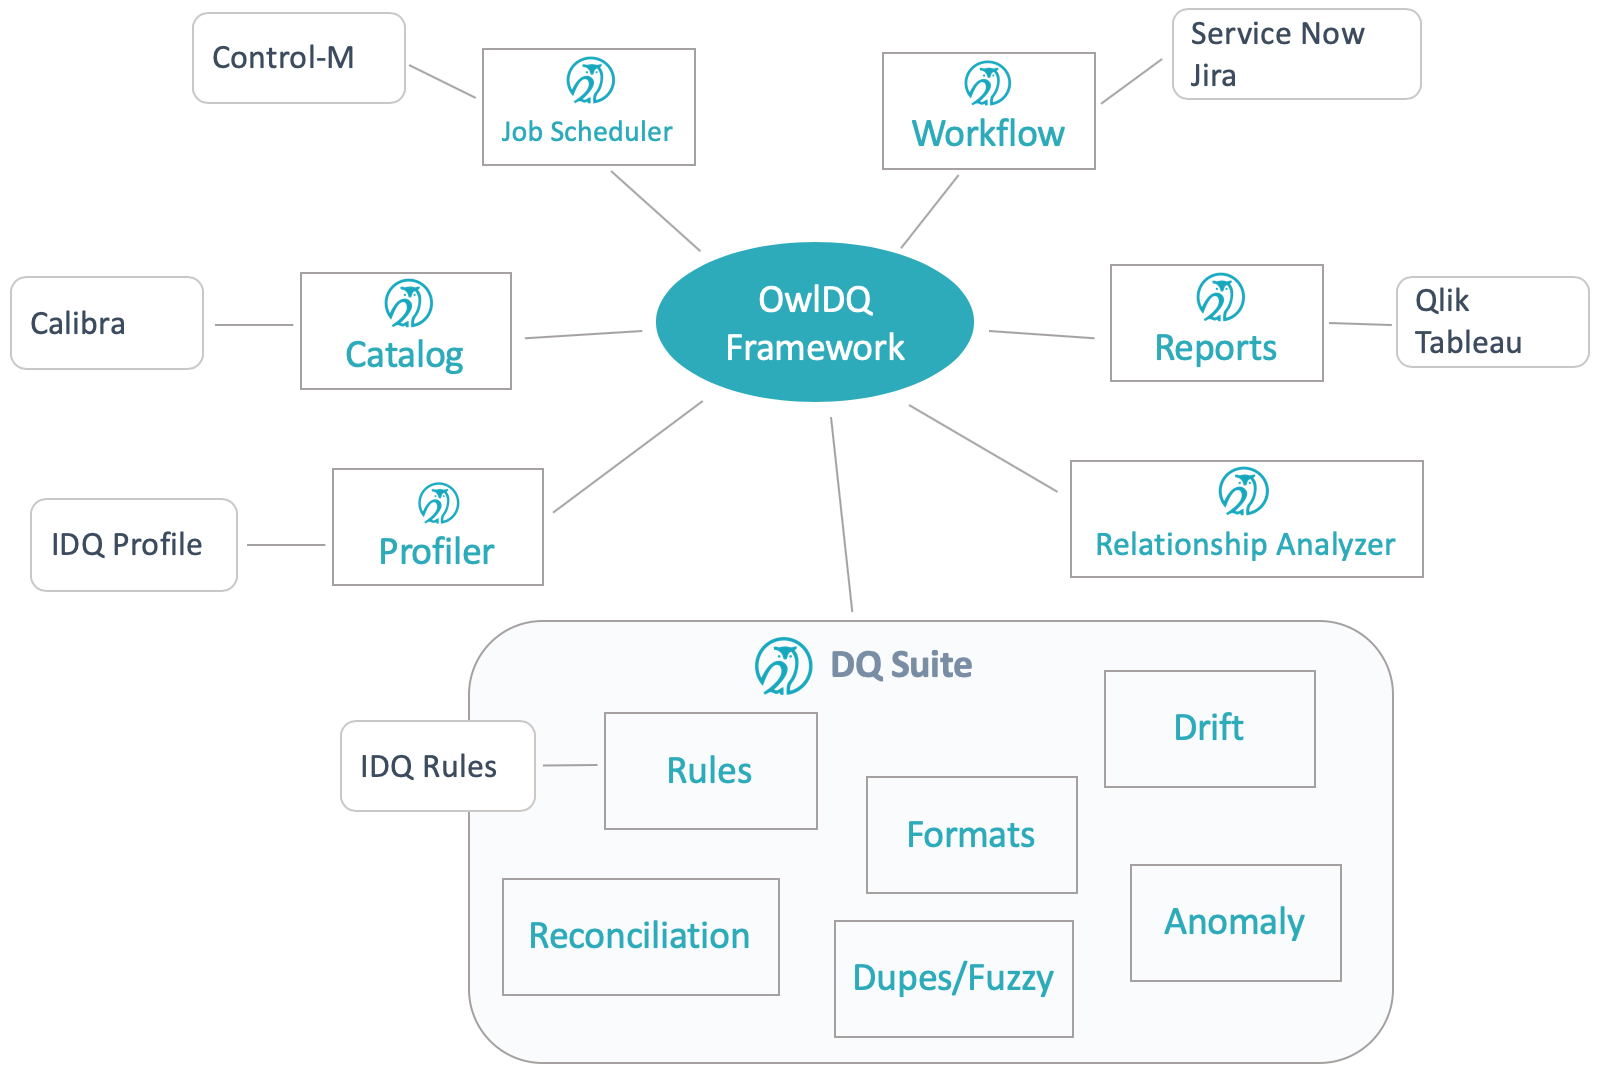
Aren't their other DQ companies and solutions on the market? Yes, absolutely. The challenge lies in the vast number of ways IT groups consume and process data. You need to find a product that can plug into Files the same way it plugs into DB Tables, Cloud File Systems, Data Frames and Kafka Topics, etc. You need a product that offers a consistent feature set and covers all nine dimensions of DQ. For most companies, DQ is an after thought, they will add-on a single dimension of DQ, such as rules or data drift.DQ offers a full data quality suite to cover the unique challenges of each data set. Complete coverage and consistency drives trust. A single scoring and reporting framework with nine pluggable features that can be activated in a tailorable DQ pipeline. DQ is horizontally scaleable, it can scan data from any location with infinity scale. Data quality needs to be abstracted from data ingestion for management to have a single normalized view of data health.
Do One Thing Extremely Well
DQ believes that data quality is such an important part of the data lifecycle that it requires a company that is solely committed to revolutionizing the way enterprises manage data quality. This is why DQ has a prescriptive approach to data quality (ML first, Rules second). The DQ software is purpose built for predicting and detecting data quality issues. Much like how Jira is used as the standard for software project management, even though it is absolutely possible to manage project line items in an excel sheet. Businesses that manage a lot of data require Score Cards, Alerts, Reports, List Views, Collaboration, Down Training, Cataloging, Scheduling and much more.
Get Started
Email us: [email protected]
Does your DQ Solution Have?
| Unified DQ | The ability to score and manage and report on all datasets (files, tables, topics) agnostically. Providing a single pane of glass for DQ across all data sources. |
| Collaboration | The ability for end-users to down-train, annotate and audit each DQ item |
| Auto Discovery | The ability to figure out issues in your data without requiring domain experts and rule writers |
| Anomaly Detection | The ability to detect numeric and categorical outliers in a dataset |
| Correlation Analysis | The ability to measure the lift or relationship between numeric columns |
| Relationship Analysis | The ability to discover and make predictions on hidden relationships in your data |
| Alerting | The ability to send out alerts when DQ scores drop |
| Scheduling | The ability to schedule DQ jobs with a click of a button in the UI |
| Profiling | The ability to provide descriptive statistics about the current run overlaid with the past runs for trend analysis |
| Reconciliation | The ability to validate the source and target dataset in timeline snapshots |
| Duplicate Detection | The ability to find exact and similar matches in data records |
| Lineage Graphs | The ability to asses business impact via a business impact score by understanding how connected each dataset is |
| Schema Evolution | The ability to detect changes in data types, additions and removals |
| Rules | The ability to write custom rules for simple and complex scenarios |