Profile (automatic)
Create profiles based on a table, view, or file.
Note Users have the option to scan the entire dataset or users can apply custom filtering to select the depth (row filtering) and width (columns).
Select the Scope
You can find detailed instructions about selecting the scope in the Explorer section. You can run limits, by time, or full table scans if you have enough resources.
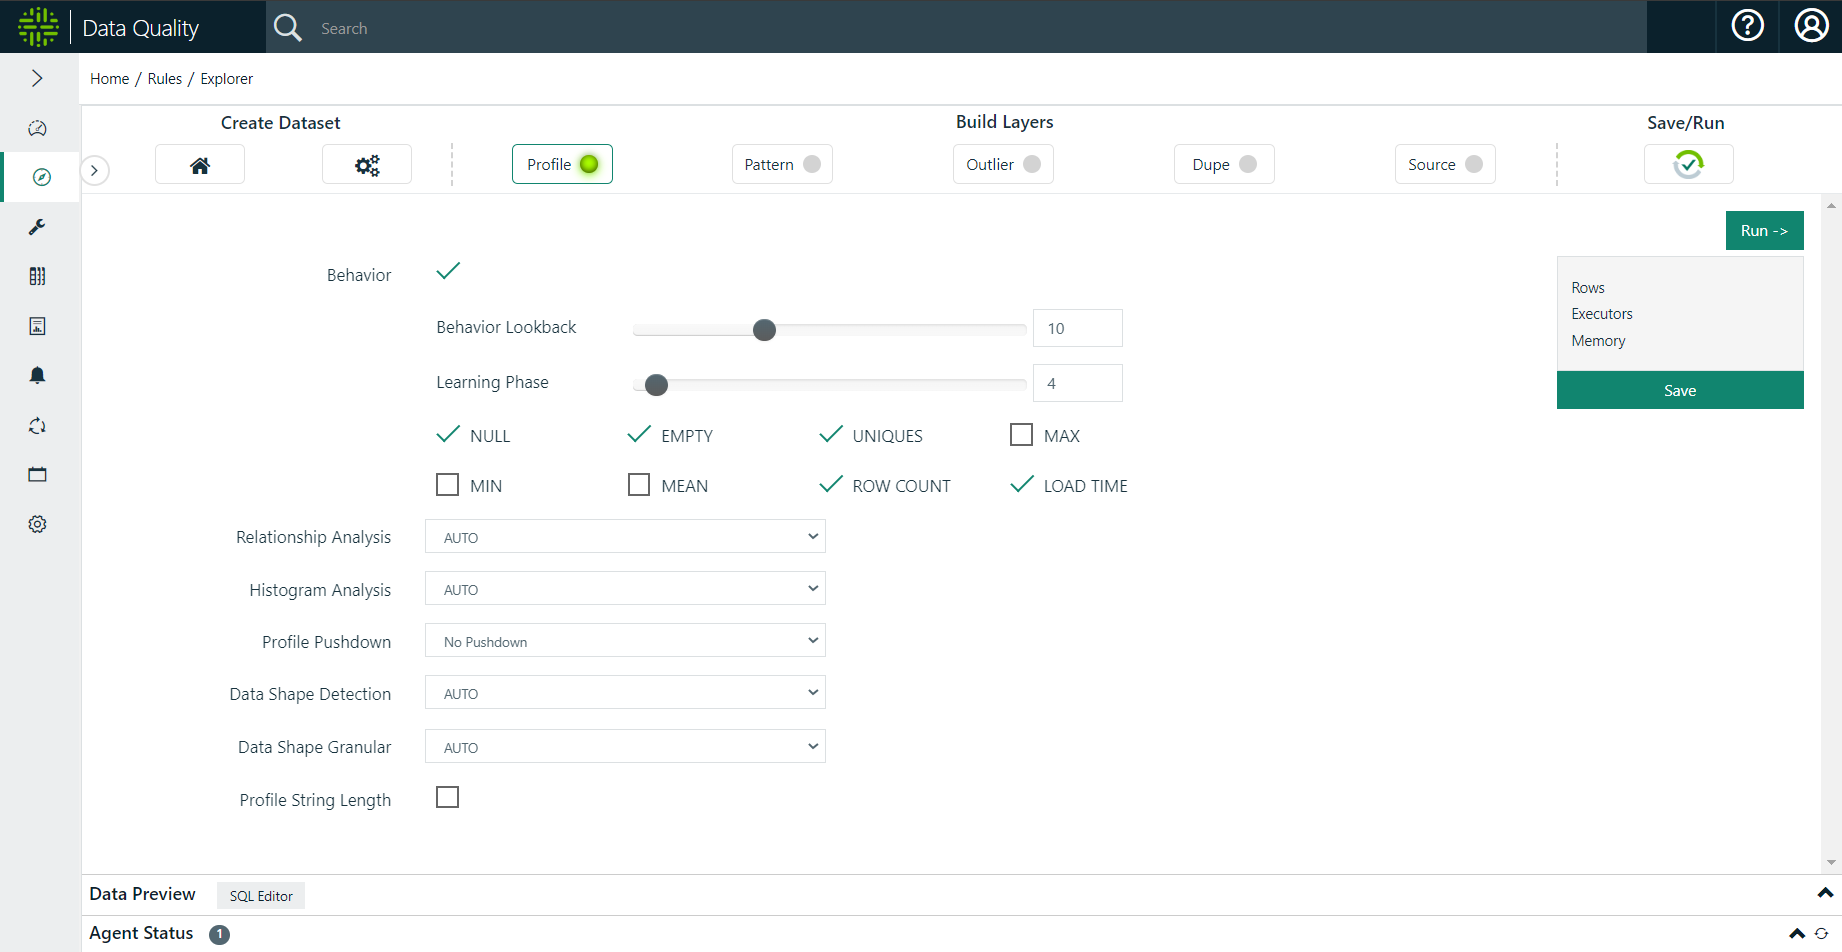
Select Options (or leave defaults)
.gif)
Save / Run
.gif)
View the Results
Automatically Profile
Collibra DQ automatically profiles data sets over time to enable drill-ins for detailed insights and automated data quality. A profile is just the first step towards an amazing amount of auto discovery. Visualize segments of the data set and how the data set changes over time.
Collibra DQ offers click or code options to run profiling.
Data Set Profile
Collibra DQ creates a detailed profile of each dataset under management. This profile will later be used to both provide insight and automatically identify data quality issues.
Pushdown Profiling
Collibra DQ can compute the Profile of a data set either via Spark (default) or a Data Warehouse (Profile Pushdown) where the data lives as the engine. When the Profile is computed using the datasource DBMS the user can choose two levels of pushdown:
- Full Profile - Perform full profile calculation except for TopN
- Count - Only perform row and column counts
.gif)
- Impala
- Hive
- Snowflake
- Presto
- Teradata
- SQL Server
- PostgreSQL
- Redshift
- MySQL
- Oracle
- DB2
Warning Pushdown and parallel JDBC cannot be used together. If you are using pushdown, do not select the parallel JDBC option.
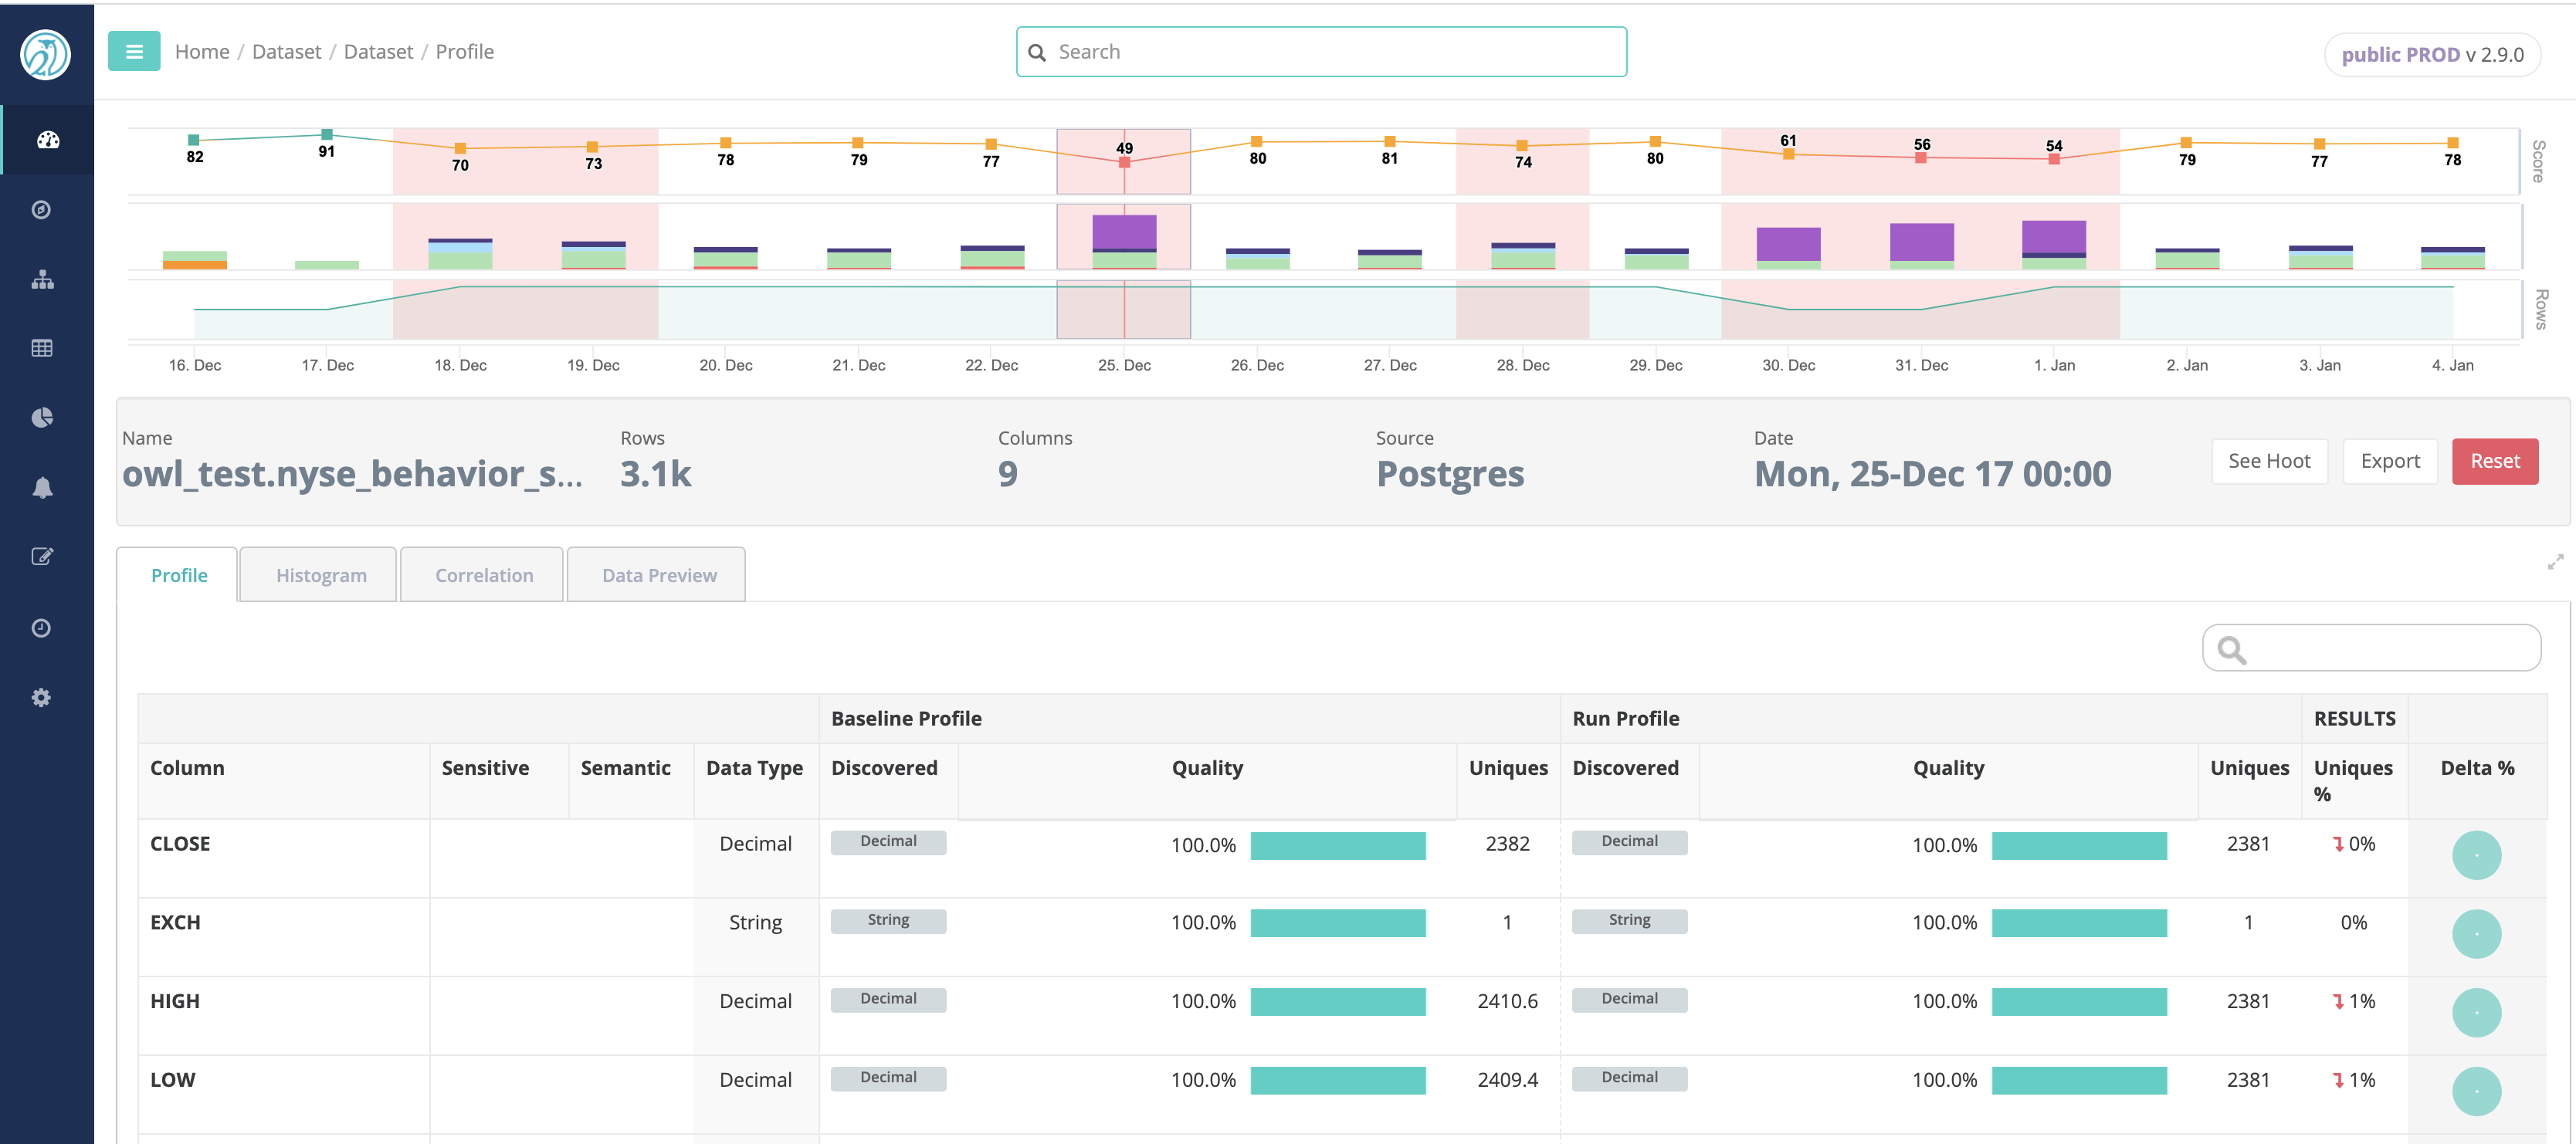
Profile Insights

By gathering a variety of different statistics, Collibra DQ's profile can provide a great deal of insight about a data set.
To see the difference between baseline (historical) and current values, Collibra DQ provides a Delta % change column. In the Delta % change column, data is represented in a pie chart for quick visualization of the changes.
To elaborate on the quality metrics:
The profile can discover attributes then helps delineate the relative metrics around numeric v. non-numeric discovered.
- Filled - [1] Integer - The percentage of data that is numeric (or non-numeric) in a numeric (or non-numeric) discovered column.
- Mixed - [String] Integer - The percentage of data that is non-numeric (or numeric) in a numeric (or non-numeric) discovered column.
- Null - [] - The percentage of data that has no value at all.
- Empty - [""] - The percentage of data that has a string instance of zero length.
Note Profile includes a range of statistics:
- Actual Datatype
- Discovered Datatypes
- Percent Null
- Percent Empty
- Percent Mixed Types
- Cardinality
- Minimum
- Maximum
- Mean
- TopN / BottomN
- Value Quartiles
- Minimum (String) Length
- Maximum (String) Length
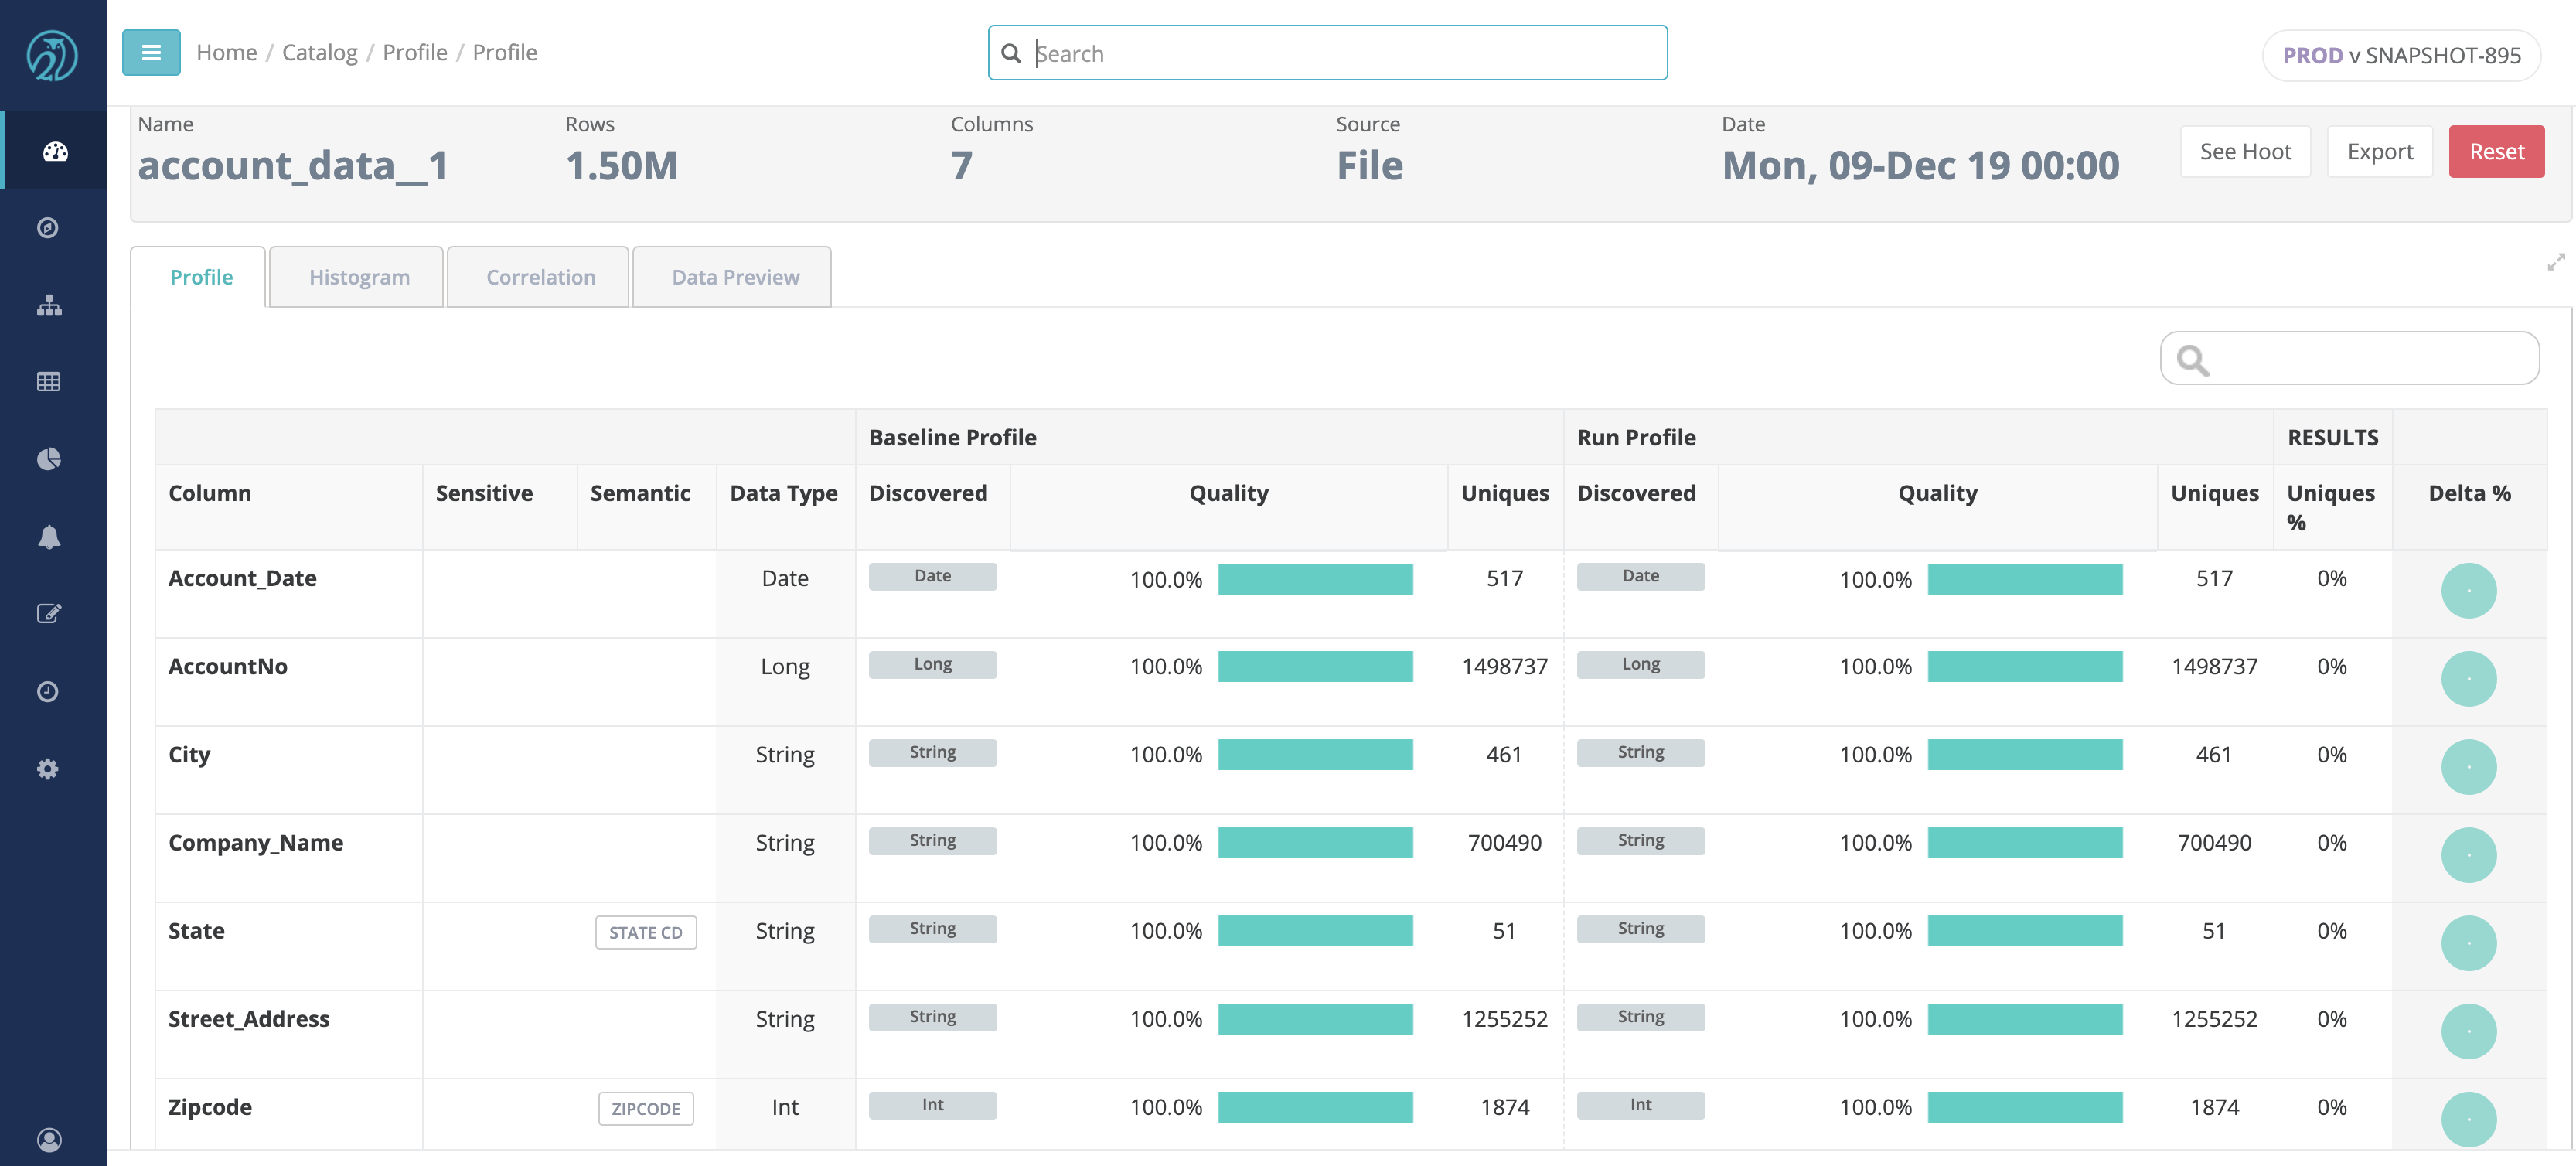
Sensitive Data Detection (Semantic)
Collibra DQ can automatically identify any type of common PII columns.
Note Collibra DQ is able to detect the following types of PII:
- PHONE
- ZIP CODE
- STATE CD
- CREDIT CARD
- GENDER
- SSN
- IP ADDRESS
- EIN
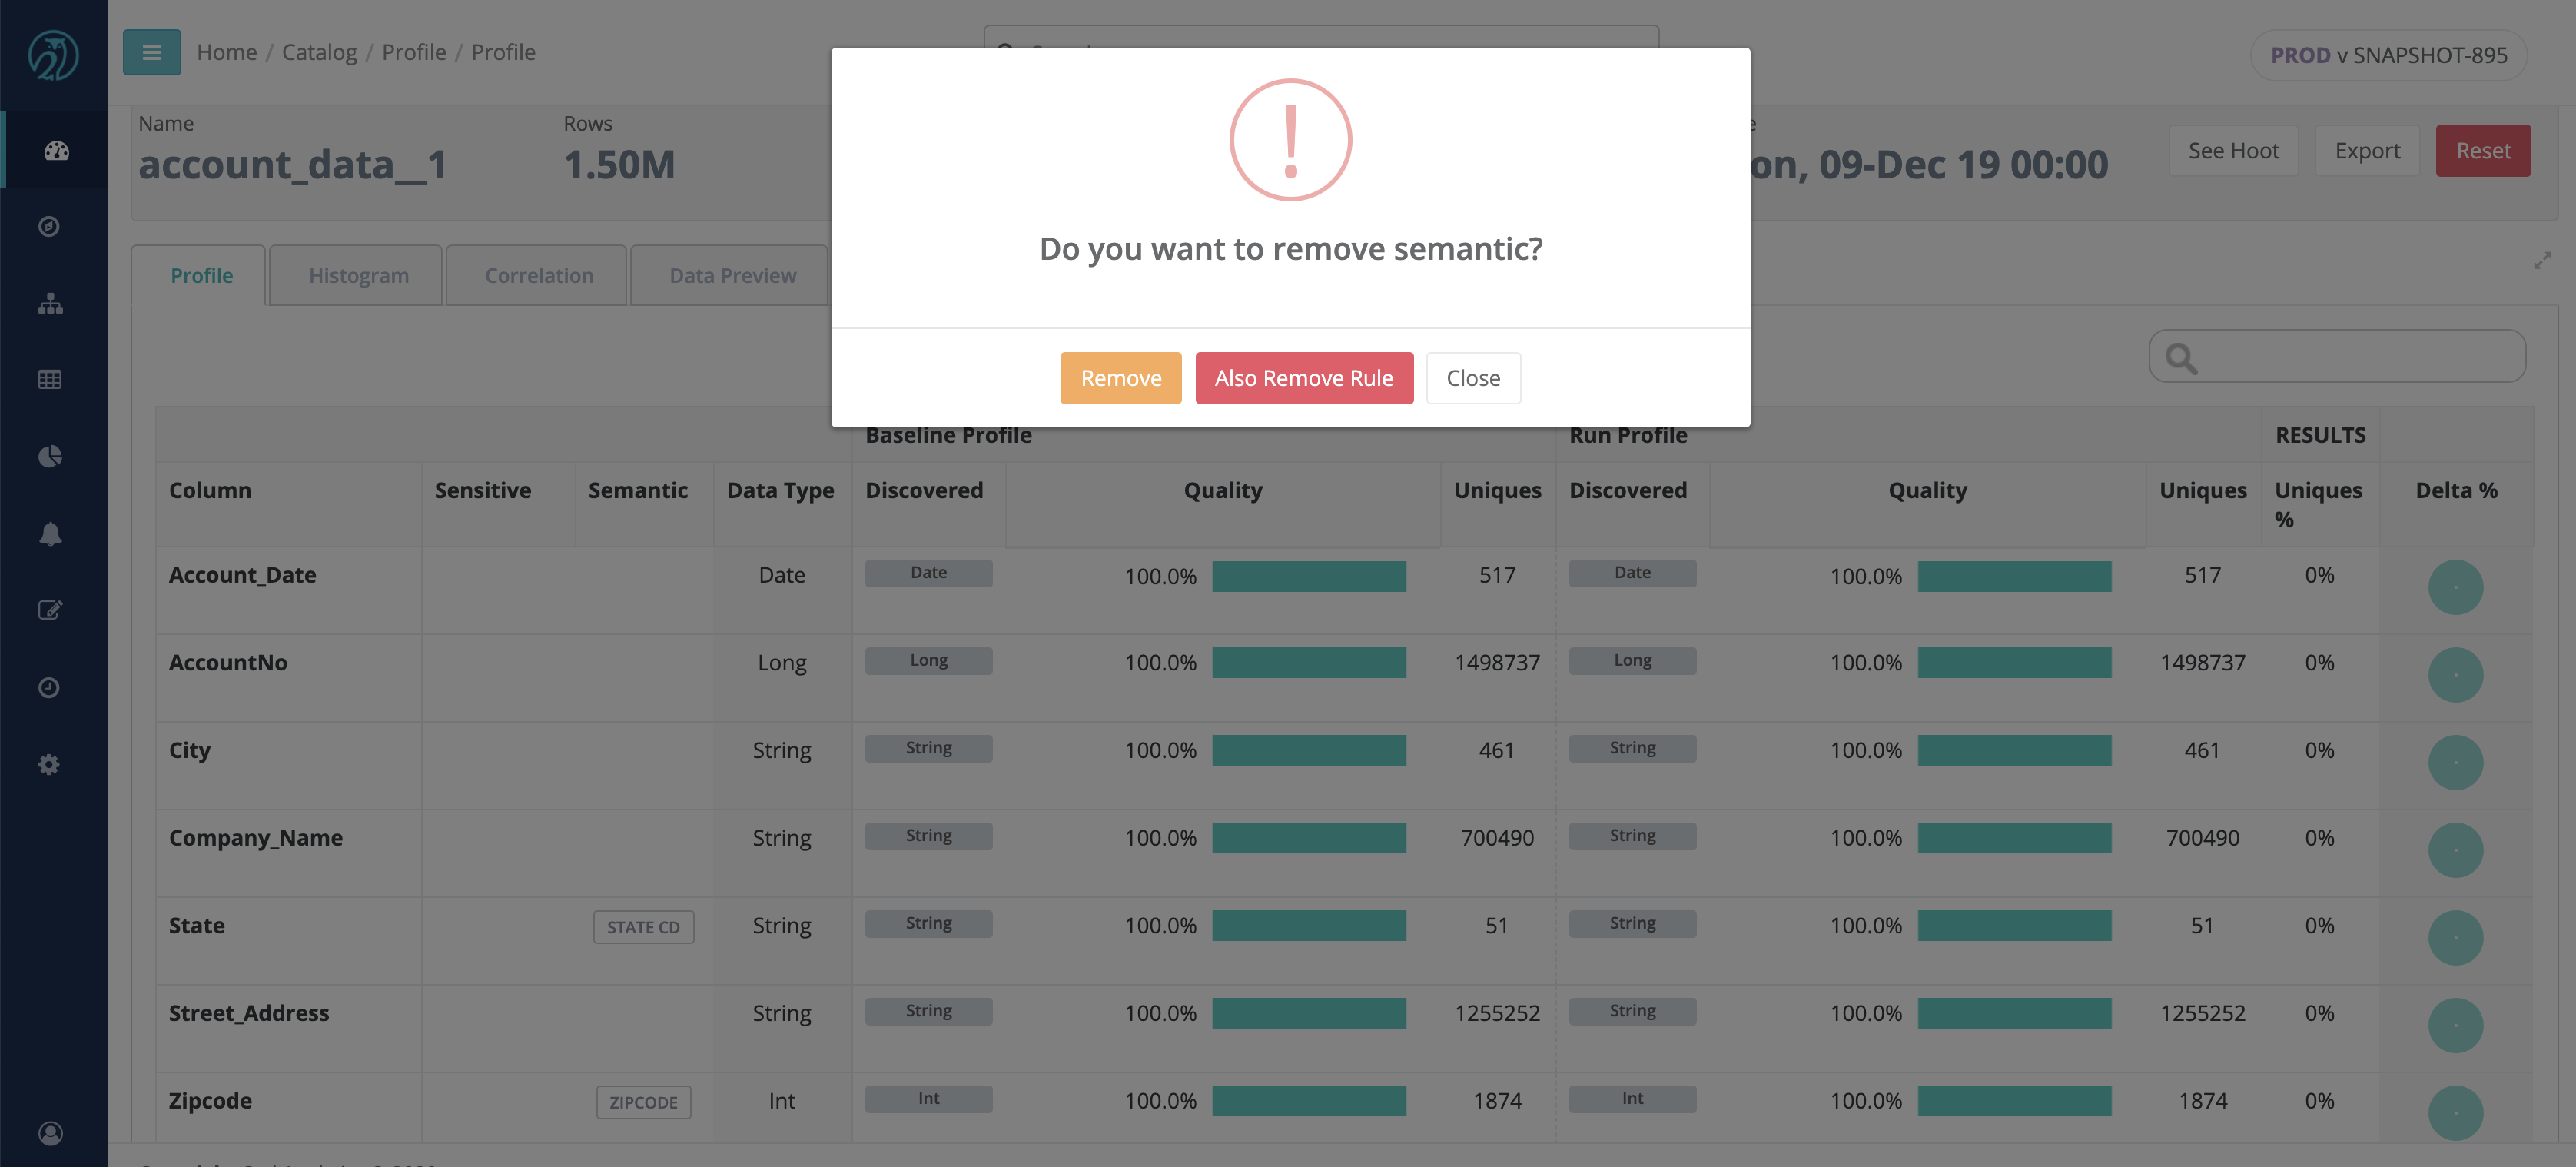
Once detected, Collibra DQ tags the column in the Profile as the discovered type and automatically applies a rule. You can choose to decline any discovered tag by clicking on it and confirming the delete action. This action also removes the rule associated with the tag.
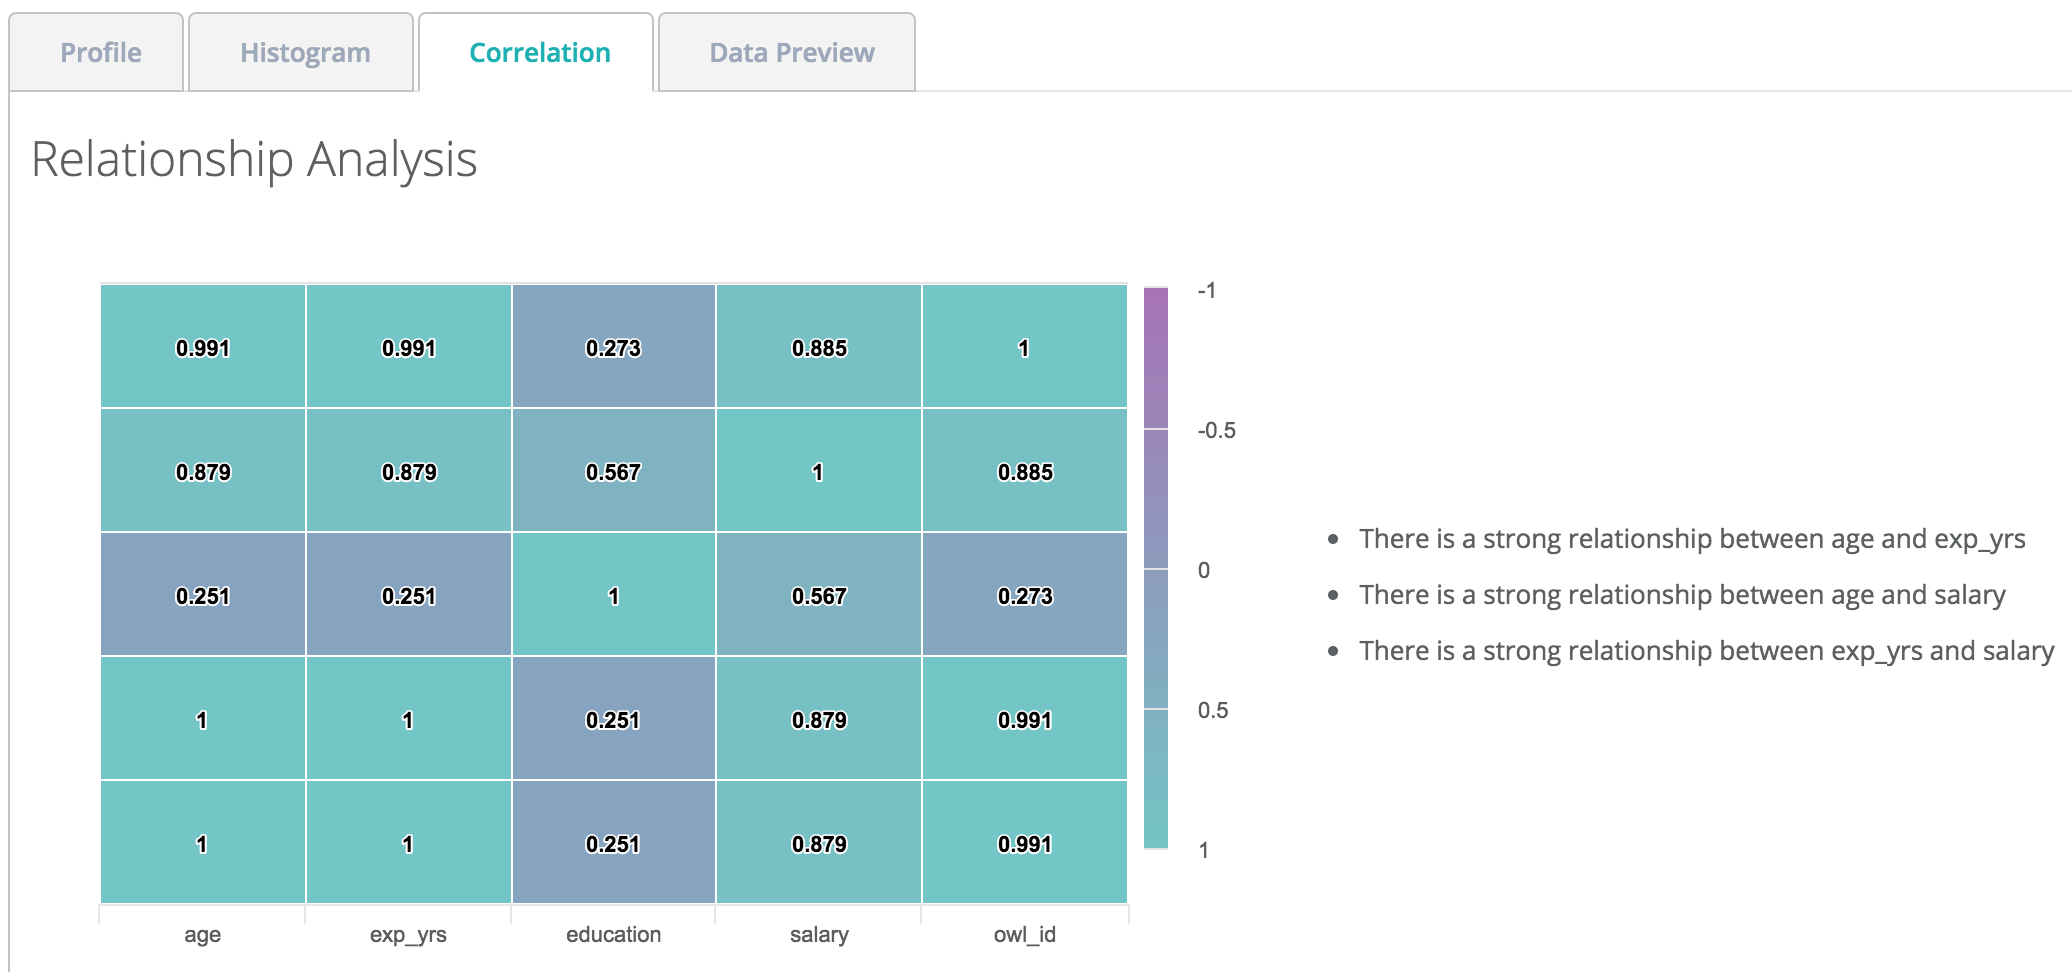
Correlation Matrix (Relationship)
Discover hidden relationships and measure the strength of those relationships.
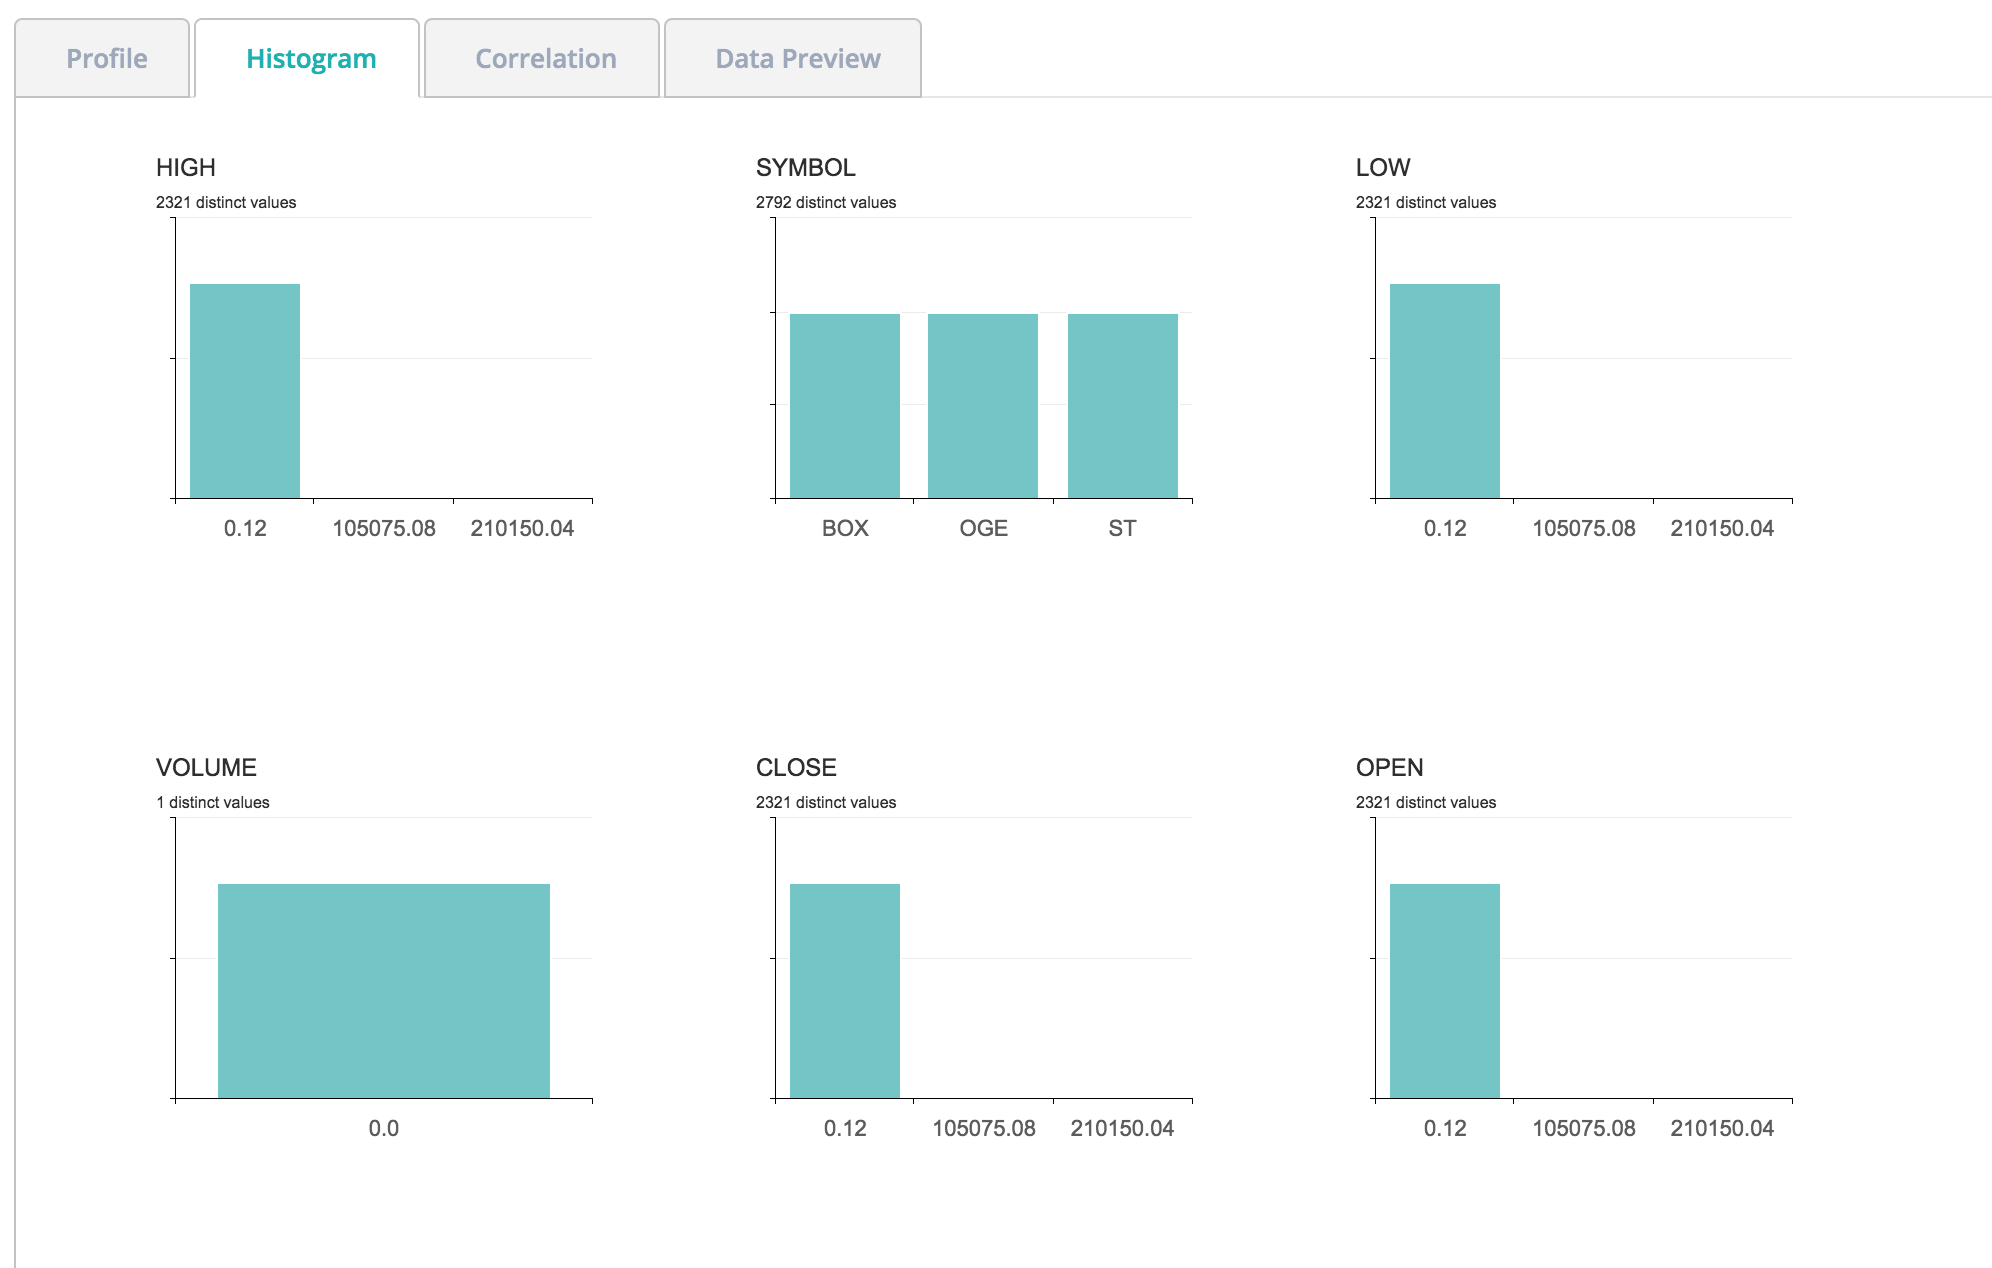
Histograms
Often the first step in a data science project is to segment the data. Collibra DQ automatically does this using histograms.
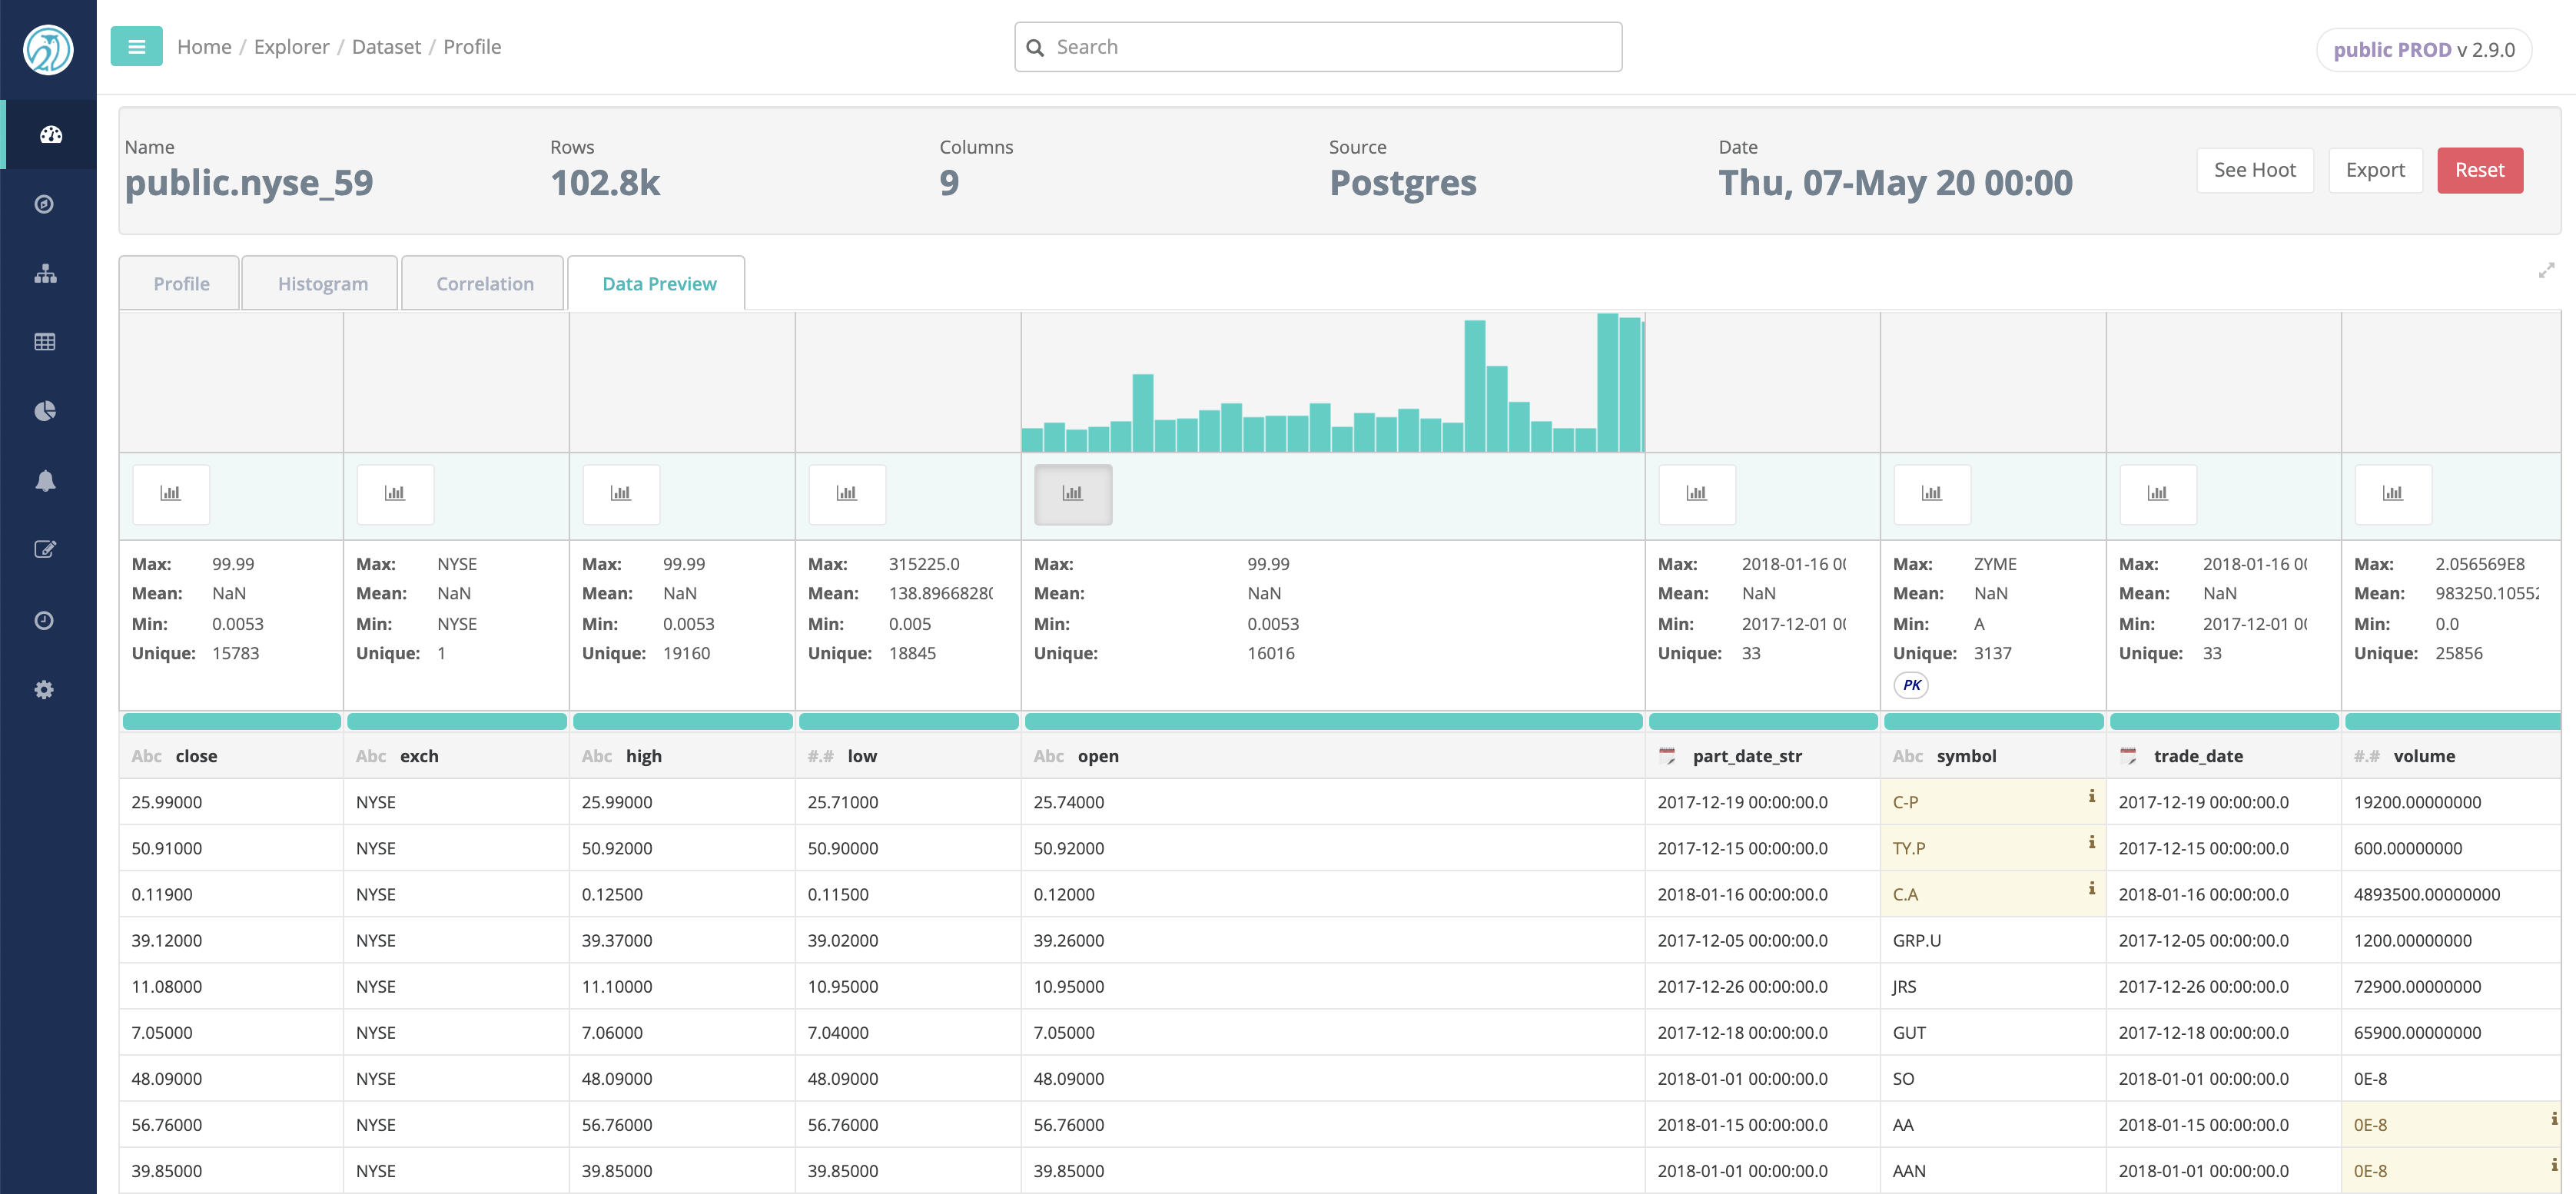
Data Preview
After profiling the data, for those users with appropriate rights, Collibra DQ provides a glimpse of the dataset. The Data preview tab also provides a some basic insights such as highlights of Data Shape issues and Outliers (if enabled), and Column Filtergram visualization.