SSRS and PBRS operating model
The lineage harvester collects SQL Server Reporting Services (SSRS) metadata and sends it to the Collibra Data Lineage server. Collibra processes the metadata and creates new SSRS assets and relations in Data Catalog. You can see them on the asset page overview or visualize them in a diagram or in a technical lineage.
- The assets have the same names as their counterparts in SSRS and Power BI Report Server (PBRS). Full names and Names cannot be changed in Data Catalog.
- Assets ingested from SSRS and PBRS are called SSRS assets in Data Catalog, except for PBRS reports which are called Power BI Report assets.
- Asset types are only created if you have all specific Data Catalog permissions.
- All SSRS and PBRS assets are created in the same domain.
- Relations that were manually created between SSRS assets or PBRS assets and other assets via a relation type in the SSRS and PBRS operating model, are deleted after synchronizing the metadata.
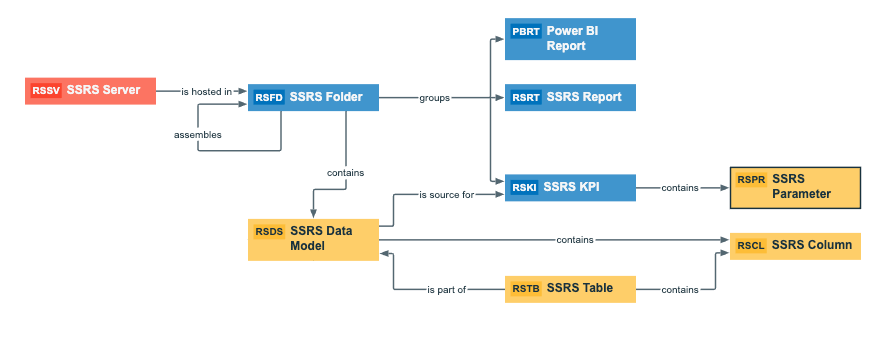
SSRS and PBRS metadata overview
The following image shows the relations between SSRS asset types and the Power BI Report asset type.
Harvested metadata per asset type
This table shows the harvested SSRS and PBRS metadata for each SSRS asset type and Power BI Report asset type, assuming you have the necessary subscriptions and configurations for a full ingestion.
| Asset type | Harvested SSRS metadata in Data Catalog |
|---|---|
| SSRS Column |
|
| SSRS Data Model |
|
|
SSRS Folder |
|
|
SSRS KPI |
|
| SSRS Parameter |
|
| SSRS Report |
|
| Power BI Report |
|
| SSRS Server |
|
| SSRS Table |
|
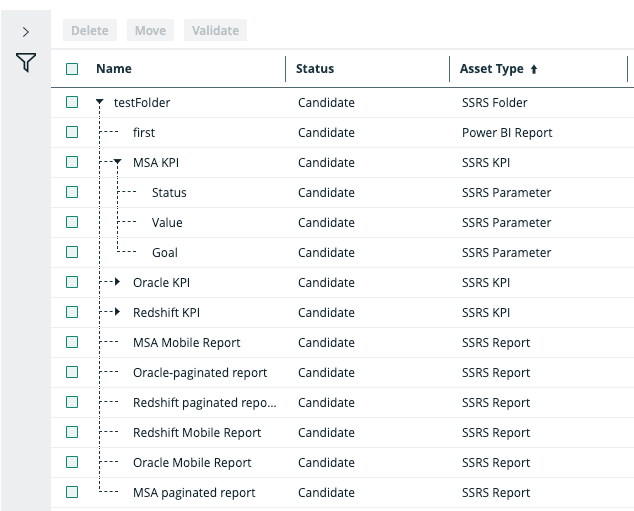
Example of ingested SSRS and PBRS metadata
The following image shows an example structure after SSRS and PBRS ingestion.
Create an SSRS and PBRS operating model diagram view
You can create a diagram view for SSRS and PBRS to visualize the operating model. Complete the following steps to create a new diagram view by copying and pasting the JSON code in the diagram view text editor.
Steps
- Open an asset page.
-
In the tab pane, click
 Diagram.
The diagram appears in the default diagram view. - Click
 to add a new view.
 - Click the Text tab, to switch to the diagram view text editor.
- Click Show me the JSON code below this procedure, to expand the code.
- Click
 in the top-right of the expanded code, to copy the code.
The code is copied to your clipboard.
in the top-right of the expanded code, to copy the code.
The code is copied to your clipboard. - Paste the code in diagram view text editor.
- Click Save.
- Edit the name and description of the diagram view, to suit your needs.
{
  "nodes": [
	{
      "id": "SSRS Column",
	  "type": {
	    "id": "00000000-0000-0000-0000-100000000029"
	   }
	 },
	 {
	    "id": "SSRS Data Model",
		"type": {
		  "id": "00000000-0000-0000-0000-100000000028"
	    }
	  },
	  {
	    "id": "SSRS Table",
		"type": {
		  "id": "00000000-0000-0000-0000-100000000030"
		 }
	   },
	   {
	     "id": "SSRS KPI",
		 "type": {
		   "id": "00000000-0000-0000-0000-100000000026"
		  }
		},
		{
		  "id": "SSRS Parameter",
		  "type": {
		    "id": "00000000-0000-0000-0000-100000000027"
		  }
		},
		{
		  "id": "SSRS Folder",
		  "type": {
		    "id": "00000000-0000-0000-0000-100000000024"
		  }
		},
		{
		  "id": "Power BI Report",
		  "type": {
		    "id": "00000000-0000-0000-0000-100000000006"
		  }
		},
		{
          "id": "SSRS Report",
		  "type": {
		    "id": "00000000-0000-0000-0000-100000000025"
		  }
		},
		{
		   "id": "SSRS Folder 2",
		   "type": {
		     "id": "00000000-0000-0000-0000-100000000024"
		   }
		 },
		 {
		   "id": "SSRS Server",
		   "type": {
			 "id": "00000000-0000-0000-0000-100000000023"
		   }
		 },
		 {
		   "id": "Column",
		   "type": {
		     "id": "00000000-0000-0000-0000-000000031008"
		   }
		 },
		 {
		   "id": "Table",
		   "type": {
		     "id": "00000000-0000-0000-0000-000000031007"
		   }
		 },
		 {
		   "id": "Schema",
		   "type": {
		     "id": "00000000-0000-0000-0001-000400000002"
		   }
		 },
		 {
		   "id": "Database",
		   "type": {
		     "id": "00000000-0000-0000-0000-000000031006"
		   }
		 }
	 ],
     "edges": [
	   {
	     "from": "SSRS Data Model",
		 "to": "SSRS Column",
		 "label": "",
		 "style": "arrow",
		 "type": {
		   "id": "00000000-0000-0000-0000-000000007196"
		 },
		 "roleDirection": true
		},
		{
		   "from": "SSRS Table",
		   "to": "SSRS Column",
		   "label": "",
		   "style": "arrow",
		   "type": {
		     "id": "00000000-0000-0000-0000-000000007047"
		   },
		   "roleDirection": true
		 },
		 {
		   "from": "SSRS Data Model",
		   "to": "SSRS Table",
		   "label": "",
		   "style": "arrow",
		   "type": {
		     "id": "00000000-0000-0000-0000-000000007046"
		   },
		   "roleDirection": true
		 },
		 {
		   "from": "SSRS Data Model",
		   "to": "SSRS KPI",
		   "label": "",
		   "style": "arrow",
		   "type": {
		     "id": "00000000-0000-0000-0000-120000000013"
		   },
		   "roleDirection": true
		 },
		 {
		   "from": "SSRS KPI",
		   "to": "SSRS Parameter",
		   "label": "",
		   "style": "arrow",
		   "type": {
		     "id": "00000000-0000-0000-0000-120000000014"
		  },
		   "roleDirection": true
		 },
		 {
		   "from": "SSRS Folder",
		   "to": "SSRS Data Model",
		   "label": "",
		   "style": "arrow",
		   "type": {
		     "id": "00000000-0000-0000-0000-120000000014"
		   },
		   "roleDirection": true
		 },
		 {
		   "from": "SSRS Folder",
		   "to": "Power BI Report",
		   "label": "",
		   "style": "boxing",
		   "type": {
		     "id": "00000000-0000-0000-0000-120000000002"
		   },
		   "roleDirection": true
		 },
		 {
		   "from": "SSRS Folder",
		   "to": "SSRS Report",
		   "label": "",
		   "style": "boxing",
		   "type": {
		     "id": "00000000-0000-0000-0000-120000000002"
		   },
		   "roleDirection": true
		 },
		 {
		   "from": "SSRS Folder",
		   "to": "SSRS KPI",
		   "label": "",
		   "style": "boxing",
		   "type": {
		     "id": "00000000-0000-0000-0000-120000000004"
		   },
		   "roleDirection": true
		 },
		 {
		   "from": "SSRS Server",
		   "to": "SSRS Folder 2",
		   "label": "",
		   "style": "boxing",
		   "type": {
		     "id": "00000000-0000-0000-0000-120000000000"
		   },
		   "roleDirection": false
		 },
		 {
		   "from": "SSRS Folder 2",
		   "to": "SSRS Folder",
		   "label": "",
		   "style": "boxing",
		   "type": {
		     "id": "00000000-0000-0000-0000-120000000001"
		   },
		   "roleDirection": true
		 },
		 {
		   "from": "SSRS Folder",
		   "to": "SSRS Server",
		   "label": "",
		   "style": "boxed",
		   "type": {
		     "id": "00000000-0000-0000-0000-120000000000"
		   },
		   "roleDirection": false
		 },
		 {
		   "from": "SSRS Report",
	       "to": "SSRS Data Model",
		   "label": "",
		   "style": "arrow",
		   "type": {
		   "id": "00000000-0000-0000-0000-120000000013"
		   },
		   "roleDirection": false
		 },
		 {
		   "from": "SSRS Column",
		   "to": "Column",
		   "label": "",
		   "style": "arrow",
		   "type": {
		     "id": "00000000-0000-0000-0000-000000007069"
		   },
		   "roleDirection": false
		 },
		 {
		   "from": "Column",
		   "to": "Table",
		   "label": "",
		   "style": "boxed",
		   "type": {
		     "id": "00000000-0000-0000-0000-000000007042"
		   },
		   "roleDirection": true
		 },
		 {
		   "from": "Table",
		   "to": "Schema",
		   "label": "",
		   "style": "boxed",
		   "type": {
		     "id": "00000000-0000-0000-0000-000000007043"
		   },
		   "roleDirection": false
		 },
		 {
		   "from": "Schema",
		   "to": "Database",
		   "label": "",
		   "style": "boxed",
		   "type": {
		     "id": "00000000-0000-0000-0000-000000007024"
		   },
		   "roleDirection": false
		  }
		],
		"showOverview": false,
		"enableFilters": true,
		"showLabels": false,
		"showFields": true,
		"showLegend": true,
		"showPreview": true,
		"visitStrategy": "directed",
		"layout": "HierarchyLeftRight",
		"maxNodeLabelLength": 50,
		"maxEdgeLabelLength": 30,
		"layoutOptions": {
		  "compactGroups": false,
		  "componentArrangementPolicy": "topmost",
		  "edgeBends": true,
		  "edgeBundling": true,
		  "edgeToEdgeDistance": 5,
		  "minimumLayerDistance": "auto",
		  "nodeToEdgeDistance": 5,
		  "orthogonalRouting": true,
		  "preciseNodeHeightCalculation": true,
		  "recursiveGroupLayering": true,
		  "separateLayers": true,
		  "webWorkers": true,
		  "nodePlacer": {
		    "barycenterMode": true,
		    "breakLongSegments": true,
		    "groupCompactionStrategy": "none",
		    "nodeCompaction": false,
		    "straightenEdges": true
		  }
		}
      }