Configure the Counters widget
You can add many different counters to the dashboard and configure them to suit your needs.
Prerequisites
- If you want to manage your own dashboard, you have a global role with the Manage your own Views, Dashboards, Search filters global permission, for example Sysadmin.
- If you want to manage another user's dashboard, you have a global role with the Manage shared Views, Dashboard and Search Filter global permission, for example Sysadmin.
Steps
-
In the main menu, click
 .
.
- If required, switch to the relevant dashboard.
- In the dashboard toolbar, click
 → Edit widgets.
 - If required, add a Counters widget to a dashboard.
- In the widget, click
 .
.
- Enter the required information.
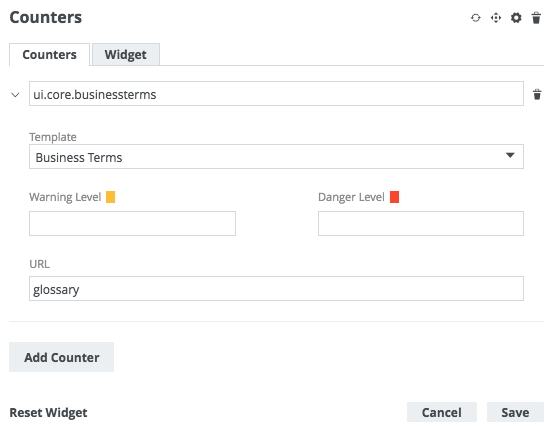
Tab Field
Description Counters Existing counter or Add Counter
Do one of the following:
- Click Add Counter, to add a new counter.
- Expand the section of an existing counter, to edit its current configuration.

Template
Select the template of the count statistic you want to show.
Warning Level and Danger Level
Optionally, enter the values that represent your warning and danger thresholds, respectively.
Note The threshold settings are designed for use with the following issue-related templates:- New Issues
- Open Issues
- Issues resolved past day
- Issues resolved pas week
URL
Optionally, specify a URL to be accessed if a user clicks the counter. The URL must lead to a page in your Collibra environment. The webpage will open in the active browser window.
- Click Save.