Edit the time range of a metrics graph
By default, the graphs on the Metrics pages are shown in daily increments, over a time range of one month. However, you can edit the time range to suit your needs.
There are two ways to edit the time range:
- Click and drag in the graph.
- Select the dates for the graph.
Click and drag in the graph
- Open the product for which you want to create the asset, for example the Business Glossary.
- In the submenu, click Metrics.
The Metrics page appears. - Optionally, Add a data set to a metrics graph a data set to a graph.
- In the relevant graph, click at (or near) the first date in your desired range, and drag to the right, toward the last date in your desired range.
While you are dragging, the color changes in the graph, indicating the resulting time range.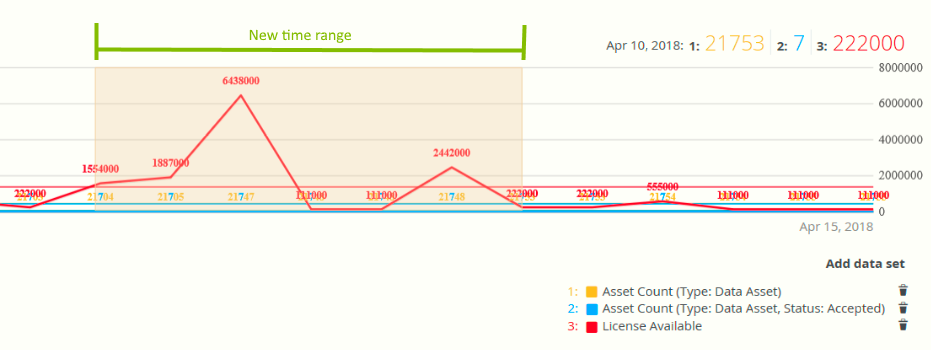
- Release the mouse button.
The graph is adjusted to the new time range.
Select the dates for the graph
- Open the product for which you want to create the asset, for example the Business Glossary.
- In the submenu, click Metrics.
The Metrics page appears. - Optionally, Add a data set to a metrics graph a data set to a graph.
- On the left-hand side of the graph, click the date.
A date picker appears.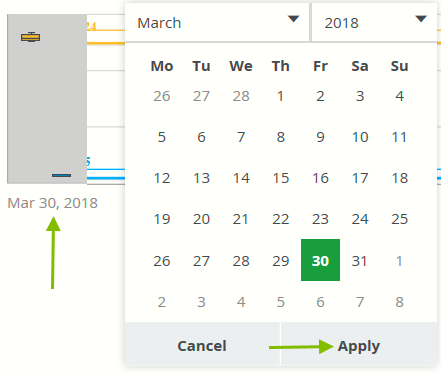
- Click the first day of your desired time range, and then click Apply.
The graph is adjusted to the date you selected. - On the right-hand side of the graph, click on the date.
A date picker appears. - Click the last day of your desired time range, and then click Apply.
The graph is adjusted to the date you selected.